

Answered step by step
Verified Expert Solution
Question
1 Approved Answer
Use the financial table in the attached file to calculate the following ratios (in an excel file) ROE, ROA, Asset Turnover, APT, ART, INVT, PPET,
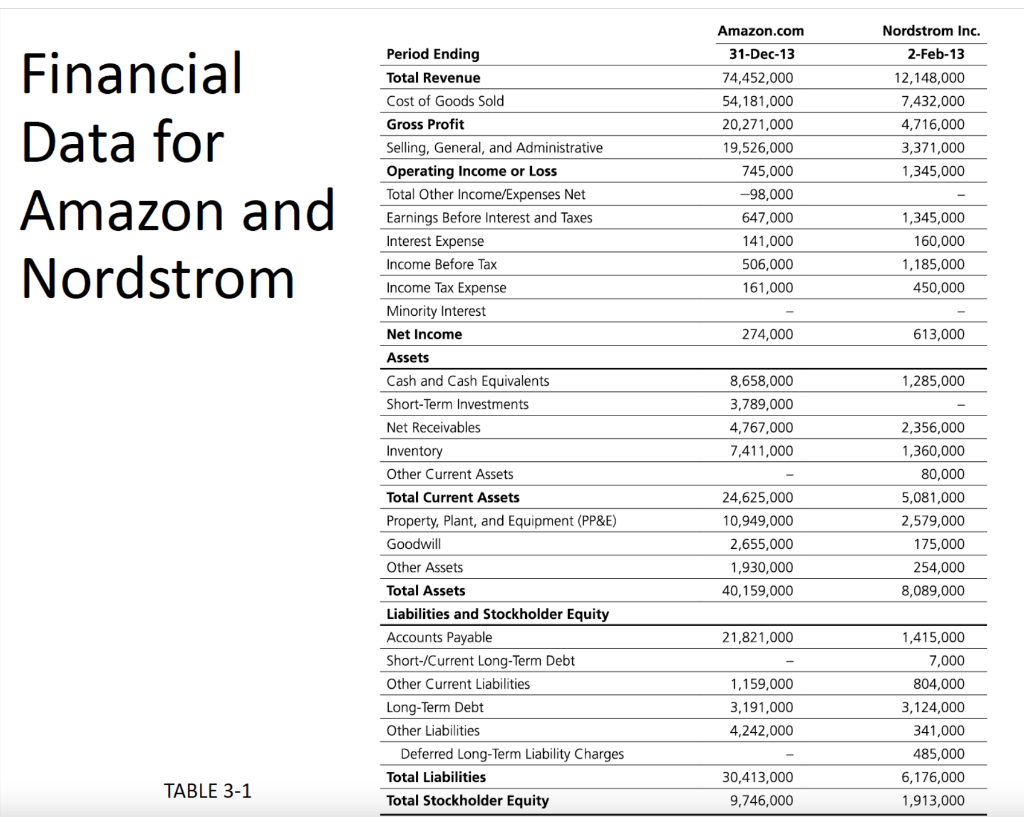
Use the financial table in the attached file to calculate the following ratios (in an excel file)
ROE, ROA, Asset Turnover, APT, ART, INVT, PPET, and C2C
Then using these ratios, comment on the type of SC strategy does each company use (efficient vs responsive)
Nordstrom Inc. Financial Data for Amazon and Nordstrom Amazon.com 31-Dec-13 74,452,000 54,181,000 20,271,000 19,526,000 745,000 -98,000 647,000 141,000 506,000 161,000 2-Feb-13 12,148,000 7,432,000 4,716,000 3,371,000 1,345,000 1,345,000 160,000 1,185,000 450,000 274,000 613,000 1,285,000 Period Ending Total Revenue Cost of Goods Sold Gross Profit Selling, General, and Administrative Operating Income or Loss Total Other Income/Expenses Net Earnings Before Interest and Taxes Interest Expense Income Before Tax Income Tax Expense Minority Interest Net Income Assets Cash and Cash Equivalents Short-Term Investments Net Receivables Inventory Other Current Assets Total Current Assets Property, Plant, and Equipment (PP&E) Goodwill Other Assets Total Assets Liabilities and Stockholder Equity Accounts Payable Short-/Current Long-Term Debt Other Current Liabilities Long-Term Debt Other Liabilities Deferred Long-Term Liability Charges Total Liabilities Total Stockholder Equity 8,658,000 3,789,000 4,767,000 7,411,000 24,625,000 10,949,000 2,655,000 1,930,000 40,159,000 2,356,000 1,360,000 80,000 5,081,000 2,579,000 175,000 254,000 8,089,000 21,821,000 1,159,000 3,191,000 4,242,000 1,415,000 7,000 804,000 3,124,000 341,000 485,000 6,176,000 1,913,000 TABLE 3-1 30,413,000 9,746,000 Nordstrom Inc. Financial Data for Amazon and Nordstrom Amazon.com 31-Dec-13 74,452,000 54,181,000 20,271,000 19,526,000 745,000 -98,000 647,000 141,000 506,000 161,000 2-Feb-13 12,148,000 7,432,000 4,716,000 3,371,000 1,345,000 1,345,000 160,000 1,185,000 450,000 274,000 613,000 1,285,000 Period Ending Total Revenue Cost of Goods Sold Gross Profit Selling, General, and Administrative Operating Income or Loss Total Other Income/Expenses Net Earnings Before Interest and Taxes Interest Expense Income Before Tax Income Tax Expense Minority Interest Net Income Assets Cash and Cash Equivalents Short-Term Investments Net Receivables Inventory Other Current Assets Total Current Assets Property, Plant, and Equipment (PP&E) Goodwill Other Assets Total Assets Liabilities and Stockholder Equity Accounts Payable Short-/Current Long-Term Debt Other Current Liabilities Long-Term Debt Other Liabilities Deferred Long-Term Liability Charges Total Liabilities Total Stockholder Equity 8,658,000 3,789,000 4,767,000 7,411,000 24,625,000 10,949,000 2,655,000 1,930,000 40,159,000 2,356,000 1,360,000 80,000 5,081,000 2,579,000 175,000 254,000 8,089,000 21,821,000 1,159,000 3,191,000 4,242,000 1,415,000 7,000 804,000 3,124,000 341,000 485,000 6,176,000 1,913,000 TABLE 3-1 30,413,000 9,746,000
Step by Step Solution
There are 3 Steps involved in it
Step: 1

Get Instant Access to Expert-Tailored Solutions
See step-by-step solutions with expert insights and AI powered tools for academic success
Step: 2

Step: 3
Ace Your Homework with AI
Get the answers you need in no time with our AI-driven, step-by-step assistance
Get Started
Recent Advances And Applications In Alternative Investments
Authors: Constantin Zopounidis, Dimitris Kenourgios ,George Dotsis
1st Edition