

Answered step by step
Verified Expert Solution
Question
1 Approved Answer
Use the following comparative figures for Apple and Google. Key Figures Net income (in millions) Cash dividends declared per common share Common shares outstanding
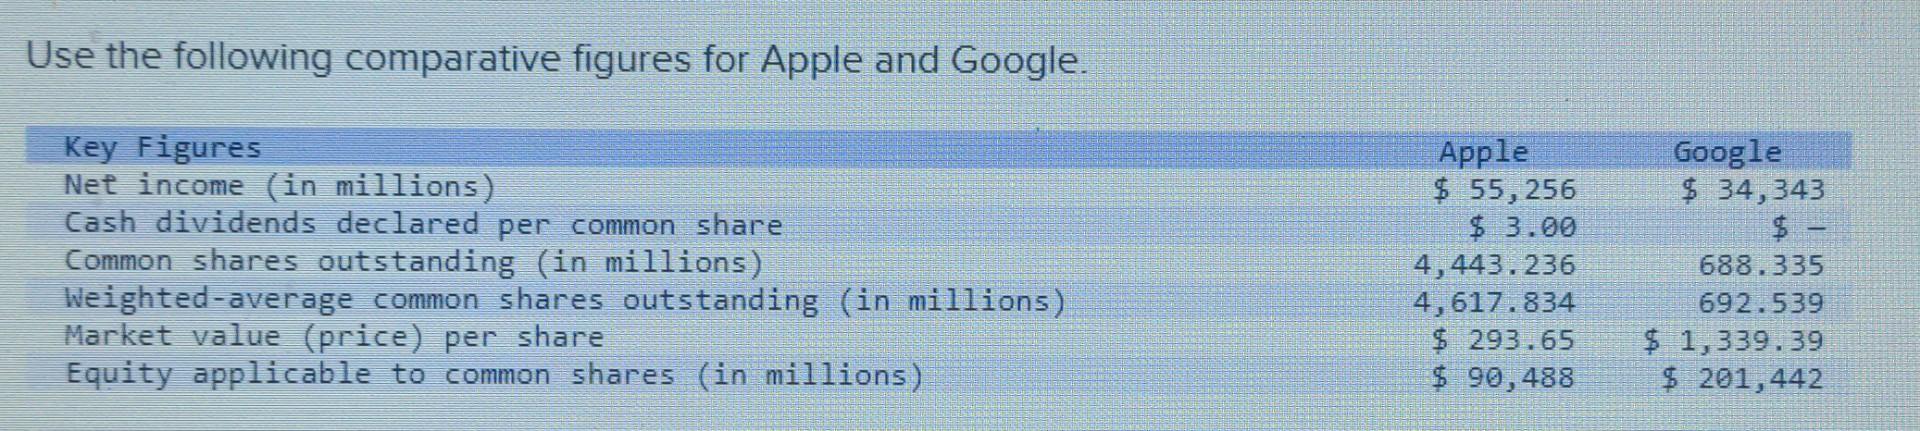


Use the following comparative figures for Apple and Google. Key Figures Net income (in millions) Cash dividends declared per common share Common shares outstanding (in millions) Weighted-average common shares outstanding (in millions) Market value (price) per share Equity applicable to common shares (in millions) Apple $ 55,256 $ 3.00 4,443.236 4,617.834 $ 293.65 $ 90,488 Google $ 34,343 $ = 688.335 692.539 $ 1,339.39 $ 201,442
Step by Step Solution
There are 3 Steps involved in it
Step: 1

Get Instant Access to Expert-Tailored Solutions
See step-by-step solutions with expert insights and AI powered tools for academic success
Step: 2

Step: 3
Ace Your Homework with AI
Get the answers you need in no time with our AI-driven, step-by-step assistance
Get Started
Financial Accounting Information for Decisions
Authors: John Wild
7th edition
78025893, 978-0078025891