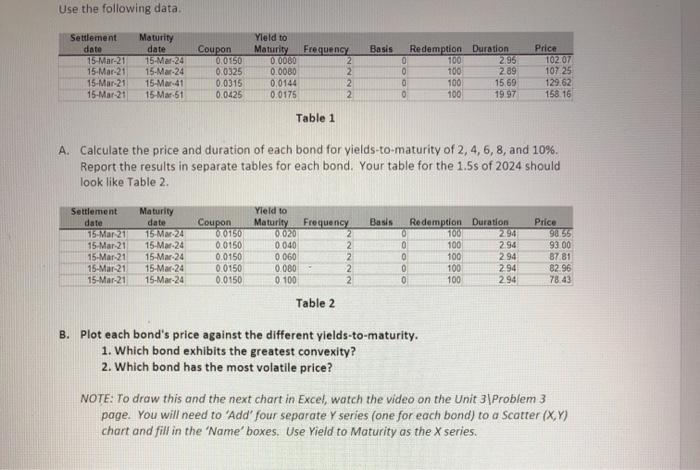
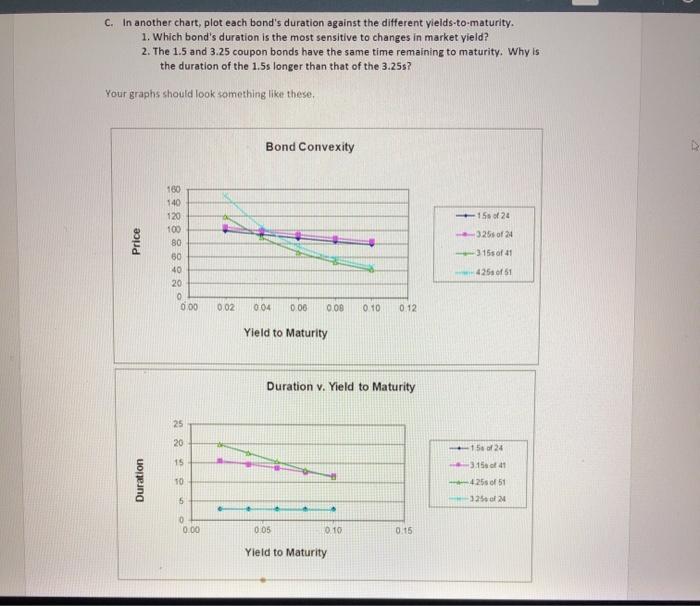
Use the following data Basis Settlement date 15-Mar-21 15-Mar-21 15-Mar-21 15-Mar-21 Maturity date 15-Mar-24 15-Mar-24 15-Mar-41 15 Mar-51 Yield to Coupon Maturity Frequency 0.0950 0.0000 0.0325 0.0080 2 0.0315 0.0144 2 0.0425 0.0175 2 Redemption Duration 0 100 2.95 0 100 2.89 100 15 69 0 100 19 97 Price TO207 107 25 129.62 158.16 Table 1 A. Calculate the price and duration of each bond for yields-to-maturity of 2, 4, 6, 8, and 10%. Report the results in separate tables for each bond. Your table for the 1.5s of 2024 should look like Table 2. Basis Settlement date 15-Mar 21 15 Mar 21 15-Mar-21 15-Mar-21 15-Mar-21 Maturity date 15 MM 24 15-Mar-24 15-Mar-24 15-Mar-24 15-Mar-24 Coupon 00750 0.0150 0.0150 0.0150 0.0150 Yield to Maturity Frequency 0020 2 0040 2 0 060 2 0.000 2 0 100 2 OOOO Redemption Duration 0 100 294 100 2.94 100 2.94 100 294 100 2.94 Price 98.55 93.00 87.81 82.96 78.43 Table 2 B. Plot each bond's price against the different yields-to-maturity. 1. Which bond exhibits the greatest convexity? 2. Which bond has the most volatile price? NOTE: To draw this and the next chart in Excel, watch the video on the Unit 3|Problem 3 page. You will need to "Add" four separate Y series (one for each bond) to a Scatter (X,Y) chart and fill in the 'Name' boxes. Use Yield to Maturity as the X series. c. In another chart, plot each bond's duration against the different yields-to-maturity. 1. Which bond's duration is the most sensitive to changes in market yield? 2. The 1.5 and 3.25 coupon bonds have the same time remaining to maturity. Why is the duration of the 1.5s longer than that of the 3.25s? Your graphs should look something like these Bond Convexity 15 of 24 326 of 24 Price 180 140 120 100 80 60 40 20 0 0.00 315 of 41 425 of 51 0.02 004 0.06 0.08 0.10 0.12 Yield to Maturity Duration v. Yield to Maturity 25 20 15 of 24 3.15 41 15 Duration 10 4255 of 51 325 24 5 0 0.00 0.05 0.10 0.15 Yield to Maturity Use the following data Basis Settlement date 15-Mar-21 15-Mar-21 15-Mar-21 15-Mar-21 Maturity date 15-Mar-24 15-Mar-24 15-Mar-41 15 Mar-51 Yield to Coupon Maturity Frequency 0.0950 0.0000 0.0325 0.0080 2 0.0315 0.0144 2 0.0425 0.0175 2 Redemption Duration 0 100 2.95 0 100 2.89 100 15 69 0 100 19 97 Price TO207 107 25 129.62 158.16 Table 1 A. Calculate the price and duration of each bond for yields-to-maturity of 2, 4, 6, 8, and 10%. Report the results in separate tables for each bond. Your table for the 1.5s of 2024 should look like Table 2. Basis Settlement date 15-Mar 21 15 Mar 21 15-Mar-21 15-Mar-21 15-Mar-21 Maturity date 15 MM 24 15-Mar-24 15-Mar-24 15-Mar-24 15-Mar-24 Coupon 00750 0.0150 0.0150 0.0150 0.0150 Yield to Maturity Frequency 0020 2 0040 2 0 060 2 0.000 2 0 100 2 OOOO Redemption Duration 0 100 294 100 2.94 100 2.94 100 294 100 2.94 Price 98.55 93.00 87.81 82.96 78.43 Table 2 B. Plot each bond's price against the different yields-to-maturity. 1. Which bond exhibits the greatest convexity? 2. Which bond has the most volatile price? NOTE: To draw this and the next chart in Excel, watch the video on the Unit 3|Problem 3 page. You will need to "Add" four separate Y series (one for each bond) to a Scatter (X,Y) chart and fill in the 'Name' boxes. Use Yield to Maturity as the X series. c. In another chart, plot each bond's duration against the different yields-to-maturity. 1. Which bond's duration is the most sensitive to changes in market yield? 2. The 1.5 and 3.25 coupon bonds have the same time remaining to maturity. Why is the duration of the 1.5s longer than that of the 3.25s? Your graphs should look something like these Bond Convexity 15 of 24 326 of 24 Price 180 140 120 100 80 60 40 20 0 0.00 315 of 41 425 of 51 0.02 004 0.06 0.08 0.10 0.12 Yield to Maturity Duration v. Yield to Maturity 25 20 15 of 24 3.15 41 15 Duration 10 4255 of 51 325 24 5 0 0.00 0.05 0.10 0.15 Yield to Maturity