

Question
Use the following data set to answer the subsequent questions: 7, 1, 3, 8, 6, 2, 5, 4, 8, 9, 6, 3, 8, 4, 9,
Use the following data set to answer the subsequent questions:
7, 1, 3, 8, 6, 2, 5, 4, 8, 9, 6, 3, 8, 4, 9, 3, 9, 7, 9, 2
1) Construct a frequency distribution table for the data. Your table must include the 'x'
column, the 'f' column, and the 'p' column. Other columns are optional.
| X | f | P | %=P x 100 | cf | C%= cfx 100 |
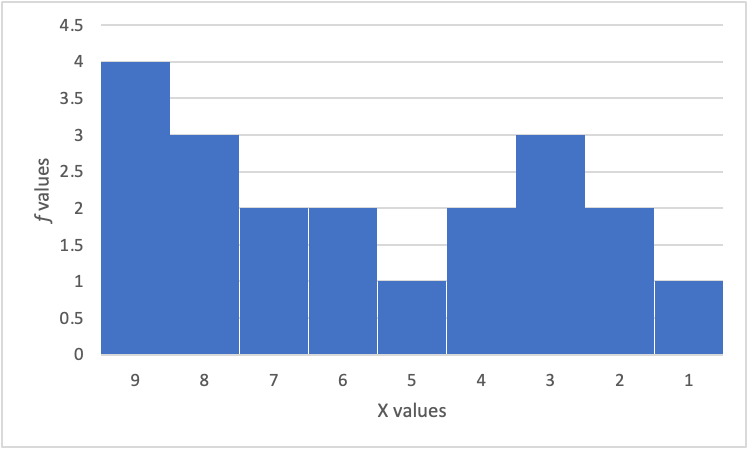
| 9 | 4 | 4/20= 0.2 | .2 x 100= 20% | 20 | 20/20x100=100% |
| 8 | 3 | 3/20= 0.15 | 0.15x100=15% | 16 | 16/20x100=80% |
| 7 | 2 | 2/20= 0.1 | 0.1x100=10% | 13 | 13/20x100=65% |
| 6 | 2 | 2/20= 0.1 | 0.1x100=10% | 11 | 11/20x100=55% |
| 5 | 1 | 1/20= 0.05 | 0.05x100=5% | 9 | 9/20x100=45% |
| 4 | 2 | 2/20= 0.1 | 0.1x100= 10% | 8 | 8/20x100=40% |
| 3 | 3 | 3/20= 0.15 | 0.15x100=15% | 6 | 6/20x100= 30% |
| 2 | 2 | 2/20= 0.1 | 0.1x100=10% | 3 | 3/20x100=15% |
| 1 | 1 | 1/20= 0.05 | 0.05x100=5% | 1 | 1/20x100=5% |
| ?f= 20 |
2) Construct a graph of the data using a histogram. Make sure that your histogram reflects the "real limits" of each value.
Step by Step Solution
There are 3 Steps involved in it
Step: 1

Get Instant Access to Expert-Tailored Solutions
See step-by-step solutions with expert insights and AI powered tools for academic success
Step: 2

Step: 3
Ace Your Homework with AI
Get the answers you need in no time with our AI-driven, step-by-step assistance
Get Started
Calculus Single Variable
Authors: Howard Anton, Irl C Bivens, Stephen Davis
11th Edition
1118885686, 9781118885680