

Question
Use the following data to explore the risk-return relation and the concept of beta for Apple stock, Kroger stock, and the S&P 500 market index:
Use the following data to explore the risk-return relation and the concept of beta for Apple stock, Kroger stock, and the S&P 500 market index:
| Year | Apple Stock Price | Kroger Stock Price | S&P 500 Market Index |
| 2020 | $252.92 | $30.71 | 3,234.85 |
| 2019 | $156.23 | $27.66 | 2,531.94 |
| 2018 | $169.23 | $27.32 | 2,753.15 |
| 2017 | $125.17 | $29.52 | 2,276.98 |
| 2016 | $108.41 | $31.80 | 2,043.94 |
| 2015 | $112.98 | $33.37 | 2,058.20 |
Part 1: Risk and Beta
- Calculate the return each year for Apple, Kroger, and the Market using the equation:
Return = (Value this year Value last year) / Value last year. In addition, use the Excel function Average to find the average of the returns.
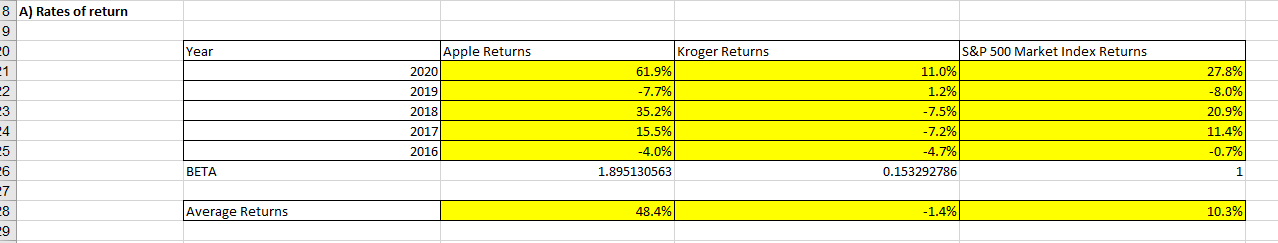
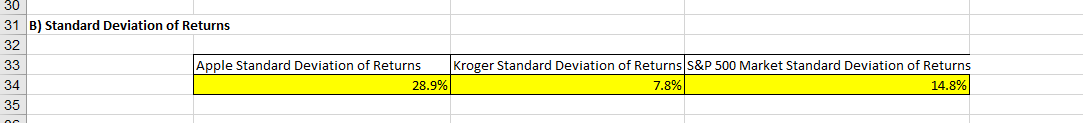
- Calculate the standard deviation of rates of return for Apple, Kroger, and the Market using the Stdev Excel function.
- HOW DO YOU DO THIS?? Make a scatter plot of stock returns (y-axis) against market returns (x-axis) for both Apple and Kroger stock in one plot. Add a linear trend line to the scatter plot for each stock and include the equation on the chart (Select data point and right click then select "add trendline" and choose a "linear" trend and select "display equation on chart"). Label the y-axis, x-axis, legend, and chart title.
- CAN YOU HELP?? For each stock, use the Excel function Correl to calculate the correlation between the stock returns and market returns. Furthermore, copy the standard deviations from above (by cell reference) and calculate the beta according to the equation: Beta = (Standard deviation of stock / Standard deviation of market) (Correlation between stock and market).

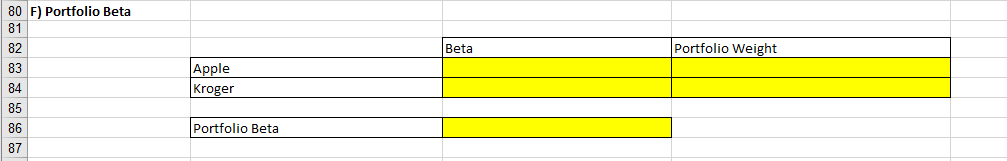
F.If you formed a portfolio that consisted of 60% Apple stock and 40% Kroger stock, calculate the beta.
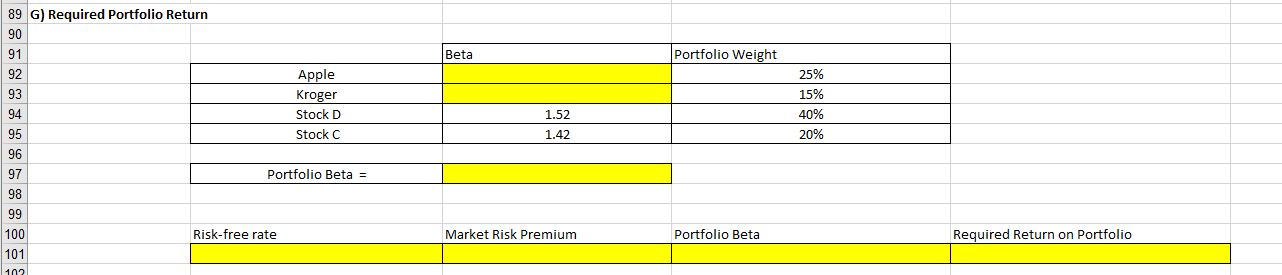
G. . Calculate the portfolio beta of the four-stock portfolio and the required return on the portfolio.
Step by Step Solution
There are 3 Steps involved in it
Step: 1

Get Instant Access to Expert-Tailored Solutions
See step-by-step solutions with expert insights and AI powered tools for academic success
Step: 2

Step: 3
Ace Your Homework with AI
Get the answers you need in no time with our AI-driven, step-by-step assistance
Get Started
International Project Finance
Authors: Felix I. Lessambo
1st Edition
3030963896, 978-3030963897