Answered step by step
Verified Expert Solution
Question
1 Approved Answer
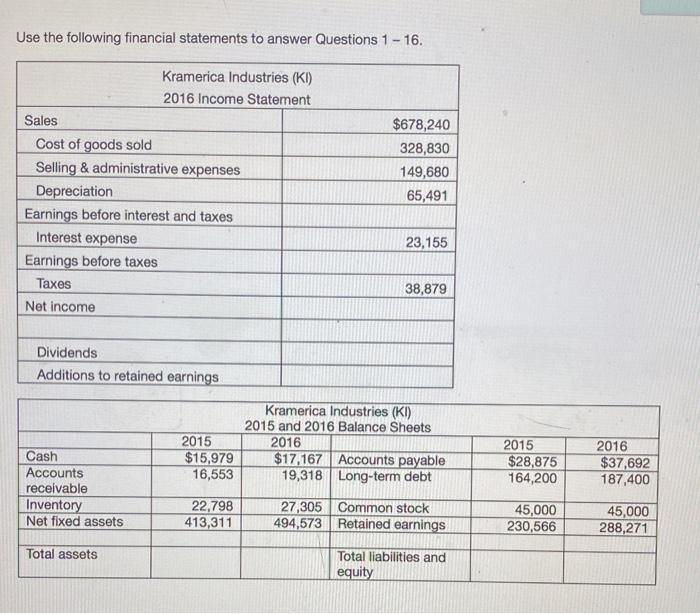
Use the following financial statements to answer Questions 1-16. Sales Cost of goods sold Selling & administrative expenses Depreciation Kramerica Industries (KI) 2016 Income


Use the following financial statements to answer Questions 1-16. Sales Cost of goods sold Selling & administrative expenses Depreciation Kramerica Industries (KI) 2016 Income Statement Earnings before interest and taxes Interest expense Earnings before taxes Taxes Net income Dividends Additions to retained earnings Cash Accounts receivable Inventory Net fixed assets Total assets 2015 $15,979 16,553 22,798 413,311 $678,240 328,830 149,680 65,491 23,155 38,879 Kramerica Industries (KI) 2015 and 2016 Balance Sheets 2016 $17,167 Accounts payable 19,318 Long-term debt 27,305 Common stock 494,573 Retained earnings Total liabilities and equity 2015 $28,875 164,200 45,000 230,566 2016 $37,692 187,400 45,000 288,271 KI's total debt ratio in 2016 is KI's times interest earned ratio in 2016 is
Step by Step Solution
★★★★★
3.42 Rating (149 Votes )
There are 3 Steps involved in it
Step: 1
Kramerica Industries KI 2016 Income Statement Sales 678240 Less Cost of goods sold 328830 Selling ad...
Get Instant Access to Expert-Tailored Solutions
See step-by-step solutions with expert insights and AI powered tools for academic success
Step: 2

Step: 3

Ace Your Homework with AI
Get the answers you need in no time with our AI-driven, step-by-step assistance
Get Started


