Answered step by step
Verified Expert Solution
Question
1 Approved Answer
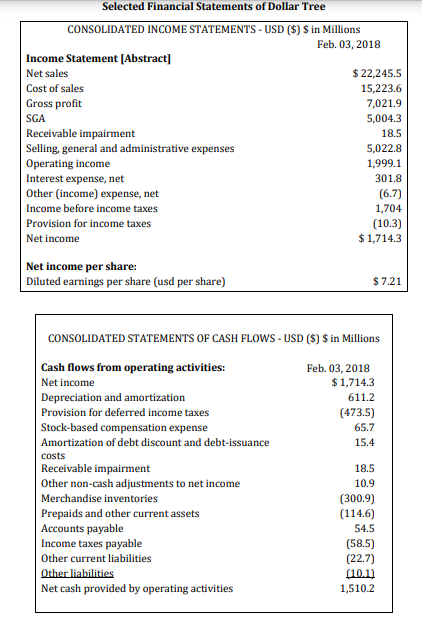
Use the following information: 22) Using Big Lots as a comparable firm, provide a valuation of the Dollar Trees equity per share based on P/E
Use the following information:


22) Using Big Lots as a comparable firm, provide a valuation of the Dollar Trees equity per share based on P/E ratio. Use the financial statements of Dollar Tree on page 5 if necessary
* in billions Big Lots Dollar General Walmart MVE* 1.2 28 273 EBITDA* 0.35 2.5 33 Cash* 0.062 0.26 9 Price DEBT* 30 0.62 106 2.9 94 61 EPS 3.7 6.78 1.75 Selected Financial Statements of Dollar Tree CONSOLIDATED INCOME STATEMENTS - USD ($) $ in Millions Feb. 03, 2018 Income Statement [Abstract] Net sales $ 22,245.5 Cost of sales 15,223.6 Gross profit 7,021.9 SGA 5,004.3 Receivable impairment 18.5 Selling, general and administrative expenses 5,022.8 Operating income 1,999.1 Interest expense, net 301.8 Other (income) expense, net (6.7) Income before income taxes 1,704 Provision for income taxes (10.3) Net income $ 1,714.3 Net income per share: Diluted earnings per share (usd per share) $ 7.21 CONSOLIDATED STATEMENTS OF CASH FLOWS - USD ($) $ in Millions Feb. 03, 2018 $ 1,714.3 611.2 (473.5) 65.7 15.4 Cash flows from operating activities: Net income Depreciation and amortization Provision for deferred income taxes Stock-based compensation expense Amortization of debt discount and debt-issuance costs Receivable impairment Other non-cash adjustments to net income Merchandise inventories Prepaids and other current assets Accounts payable Income taxes payable Other current liabilities Other liabilities Net cash provided by operating activities 18.5 10.9 (300.9) (114.6) 54.5 (58.5) (22.7) (101) 1,5102 * in billions Big Lots Dollar General Walmart MVE* 1.2 28 273 EBITDA* 0.35 2.5 33 Cash* 0.062 0.26 9 Price DEBT* 30 0.62 106 2.9 94 61 EPS 3.7 6.78 1.75 Selected Financial Statements of Dollar Tree CONSOLIDATED INCOME STATEMENTS - USD ($) $ in Millions Feb. 03, 2018 Income Statement [Abstract] Net sales $ 22,245.5 Cost of sales 15,223.6 Gross profit 7,021.9 SGA 5,004.3 Receivable impairment 18.5 Selling, general and administrative expenses 5,022.8 Operating income 1,999.1 Interest expense, net 301.8 Other (income) expense, net (6.7) Income before income taxes 1,704 Provision for income taxes (10.3) Net income $ 1,714.3 Net income per share: Diluted earnings per share (usd per share) $ 7.21 CONSOLIDATED STATEMENTS OF CASH FLOWS - USD ($) $ in Millions Feb. 03, 2018 $ 1,714.3 611.2 (473.5) 65.7 15.4 Cash flows from operating activities: Net income Depreciation and amortization Provision for deferred income taxes Stock-based compensation expense Amortization of debt discount and debt-issuance costs Receivable impairment Other non-cash adjustments to net income Merchandise inventories Prepaids and other current assets Accounts payable Income taxes payable Other current liabilities Other liabilities Net cash provided by operating activities 18.5 10.9 (300.9) (114.6) 54.5 (58.5) (22.7) (101) 1,5102Step by Step Solution
There are 3 Steps involved in it
Step: 1

Get Instant Access to Expert-Tailored Solutions
See step-by-step solutions with expert insights and AI powered tools for academic success
Step: 2

Step: 3

Ace Your Homework with AI
Get the answers you need in no time with our AI-driven, step-by-step assistance
Get Started


