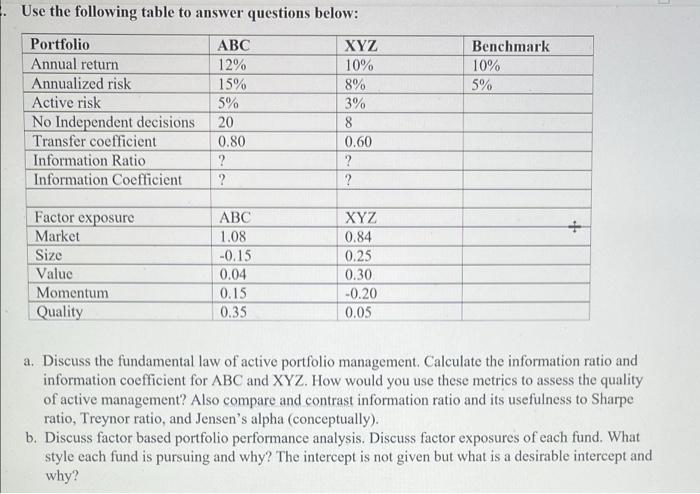
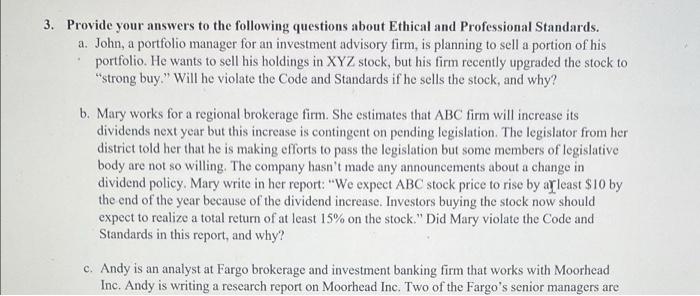
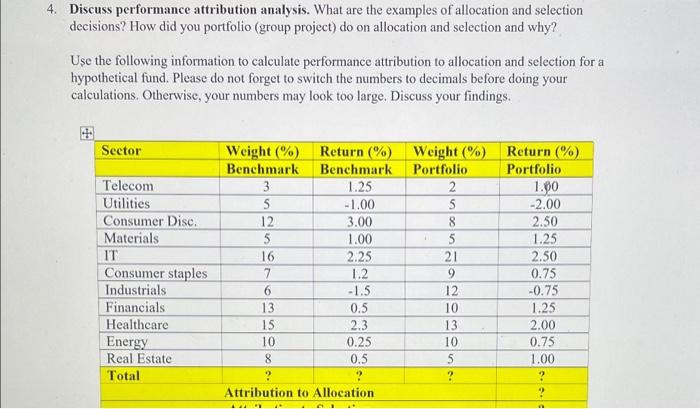
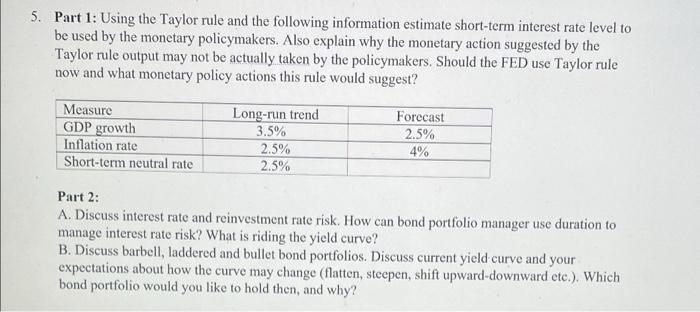
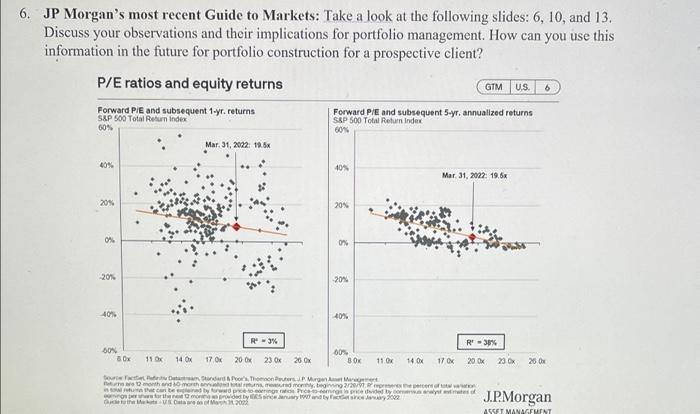
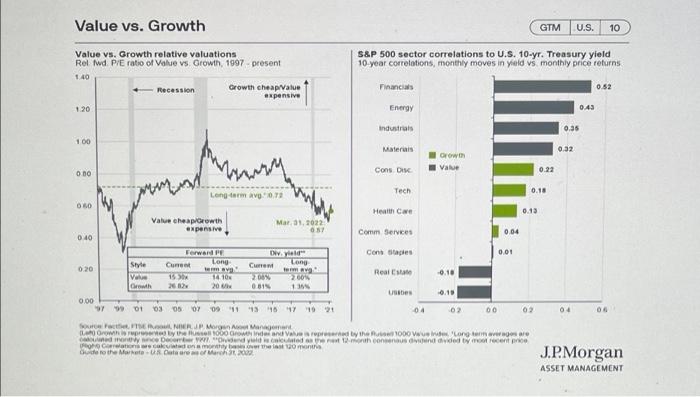
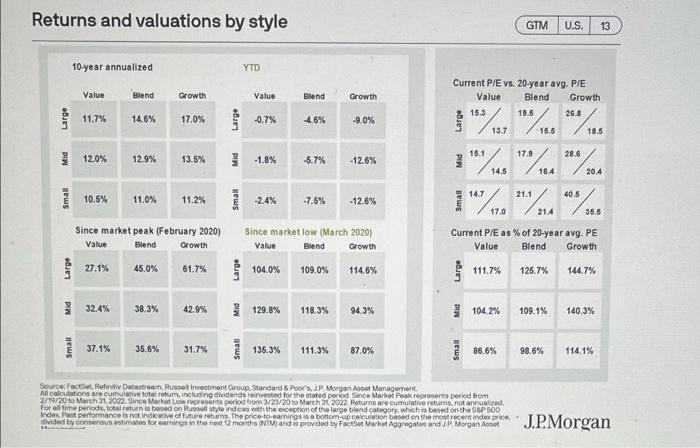
. Use the following table to answer questions below: Benchmark 10% 5% Portfolio Annual return Annualized risk Active risk No Independent decisions Transfer coefficient Information Ratio Information Coefficient ABC 12% 15% 5% 20 0.80 ? ? XYZ 10% 8% 3% 8 0.60 ? ? + Factor exposure Market Size Value Momentum Quality ABC 1.08 -0.15 0.04 0.15 0.35 XYZ 0.84 0.25 0.30 -0.20 0.05 a. Discuss the fundamental law of active portfolio management. Calculate the information ratio and information coefficient for ABC and XYZ. How would you use these metrics to assess the quality of active management? Also compare and contrast information ratio and its usefulness to Sharpe ratio, Treynor ratio, and Jensen's alpha (conceptually). b. Discuss factor based portfolio performance analysis. Discuss factor exposures of each fund. What style each fund is pursuing and why? The intercept is not given but what is a desirable intercept and why? 3. Provide your answers to the following questions about Ethical and Professional Standards. a. John, a portfolio manager for an investment advisory firm, is planning to sell a portion of his portfolio. He wants to sell his holdings in XYZ stock, but his firm recently upgraded the stock to strong buy." Will he violate the Code and Standards if he sells the stock, and why? b. Mary works for a regional brokerage firm. She estimates that ABC firm will increase its dividends next year but this increase is contingent on pending legislation. The legislator from her district told her that he is making efforts to pass the legislation but some members of legislative body are not so willing. The company hasn't made any announcements about a change in dividend policy. Mary write in her report: "We expect ABC stock price to rise by afleast $10 by the end of the year because of the dividend increase. Investors buying the stock now should expect to realize a total return of at least 15% on the stock." Did Mary violate the Code and Standards in this report, and why? c. Andy is an analyst at Fargo brokerage and investment banking firm that works with Moorhead Inc. Andy is writing a research report on Moorhead Inc. Two of the Fargo's senior managers are directors at Moorhead's subsidiaries. Should Andy write a research report on Moorhead? If no, why, and yes, how can he make sure that his actions comply with the Code and Standards. 4. Discuss performance attribution analysis. What are the examples of allocation and selection decisions? How did you portfolio (group project) do on allocation and selection and why? Use the following information to calculate performance attribution to allocation and selection for a hypothetical fund. Please do not forget to switch the numbers to decimals before doing your calculations. Otherwise, your numbers may look too large. Discuss your findings. Sector Telecom Utilities Consumer Disc Materials IT Consumer staples Industrials Financials Healthcare Energy Real Estate Total Weight (%) Return %) Weight (%) Return (%) Benchmark Benchmark Portfolio Portfolio 3 1.25 2 1.90 5 -1.00 5 -2.00 12 3.00 8 2.50 5 1.00 5 1.25 16 2.25 21 2.50 7 1.2 9 0.75 6 -1.5 12 -0.75 13 0.5 10 1.25 15 2.3 13 2.00 10 0.25 10 0.75 8 5 1.00 ? ? Attribution to Allocation 0.5 5. Part 1: Using the Taylor rule and the following information estimate short-term interest rate level to be used by the monetary policymakers. Also explain why the monetary action suggested by the Taylor rule output may not be actually taken by the policymakers. Should the FED use Taylor rule now and what monetary policy actions this rule would suggest? Measure GDP growth Inflation rate Short-term neutral rate Long-run trend 3.5% 2.5% 2.5% Forecast 2.5% 4% Part 2: A. Discuss interest rate and reinvestment rate risk. How can bond portfolio manager use duration to manage interest rate risk? What is riding the yield curve? B. Discuss barbell, laddered and bullet bond portfolios. Discuss current yield curve and your expectations about how the curve may change (flatten, steepen, shift upward-downward etc.). Which bond portfolio would you like to hold then, and why? 6. JP Morgan's most recent Guide to Markets: Take a look at the following slides: 6, 10, and 13. Discuss your observations and their implications for portfolio management. How can you use this information in the future for portfolio construction for a prospective client? P/E ratios and equity returns Forward PE and subsequent 1.yr. returns Forward P/E and subsequent 5-yr. annualized returns S&P 500 Total Retum Index GTM U.S. 6 S&P 500 Total Rolun Index 60% 60% Mar 31, 2022: 19.8x 40% 40% Mar 31, 2022: 19.6% 20% 20% on 0% 20% 204 40% 40% R3% R-30% SON 80x 11 0 14 OX 17 OK 20 OK 00% 80% 23 x 26 x 11. OK 140X 17 OK 20 Ox 23 200 total There 20 by forward to Orte tyydyy2002 VOM 2002 J.P. Morgan ASSET MANAGEUENT Value vs. Growth GTM U.S. 10 S&P 500 sector correlations to U.S. 10-yr. Treasury yield 10-year correlations, monthly moves in yield vs monthly price returns Value vs. Growth relative valuations Rel fwd Pre ratio of Value vs Growth, 1997 present 140 Recession Growth cheap Value expensive 1.20 Financial 0.52 Energy 0.43 Industrials 0.35 100 Materiais 0.32 Orow Valve Cons DIN 0.00 0.22 Tech 0.18 Long-term V.0.71 00 Health Care 0.13 Value cheap Growth expensive Mar 31.1022 037 Comm Services 0.04 0.40 Long Forward Dwyield Cons Staples 0.01 Style Current Curre 0.20 Long va Real -0.10 V 110 2009 Growth 20 0315 Us 0.00 979 01 03 05 07 09 11 13 15 17 19 21 02 00 02 SNR JP Morgen 100 Growind and Valve rupted by the 1000 wong lanare de Dedilhanted to consens du detyr recent price Crocodylot do the MUR Dataran 04 04 J.P. Morgan ASSET MANAGEMENT Returns and valuations by style GTM U.S. 13 10-year annualized YTD Value Blend Growth Value Blend Growth Current P/E vs. 20-year avg. P/E Value Blend Growth 15.3 19.5 26.8 Large 11.7% 14.6% 17.0% Large -0.7% 4.6% -9.0% Large )..... 13.7 15.5 18.6 15.1 17.9 28.6 12.0% 12.9% 13.5% 1,8% -5.7% -12.6% 14.5 204 21.1 40.5 Small 10.5% 11.0% 11.2% Small -2.4% -7.6% -12.6% "/m..."). **.56 17.0 21.4 35,5 Since market peak (February 2020) Value Blend Growth Since market low (March 2020) Value Blend Growth Current P/E as % of 20-year avg. PE Value Blend Growth Large 27.1% 45.0% 61.7% Large 104.0% 109.0% 114.6% Large 111.7% 125.7% 144.7% 32.4% 38.3% 42.9% 129.8% 118,3% 94.3% 104.2% 109.1% 140.3% Small 37.1% 35.6% 31.7% Small 135.3% 111.3% 87.0% Small 86,6% 98.6% 114.1% SourceFacet. Hofitiv Datastrom, Russell Investment Group. Standard & Poor's, JP Morgan por Management All coloutations are cute total return, including dividends revested for the stated period Since Market Peak representa period from 2/19/2010 March 21,2022. Gince Market Low represent period from 1/23/2010 March 31, 2002. Poturno ero cumulative returns, not annuaired For me periode, total return is based on Russell style indices with the exception of the large blend category, which is based on the P500 Index performance in vot indicative of future returns. The price to earnings is a bottom-up calculation based on the most recent index price, divided by connus estimates for earnings in the next 12 months NTM) and is provided by FactSet Market Aggregates and JP Morgan J.P. Morgan