Question
use the forecasted data to create the patient arrival in the simulation model. Among the patient arrivals, 50% of patient arrivals to the ED are
use the forecasted data to create the patient arrival in the simulation model. Among the patient arrivals, 50% of patient arrivals to the ED are ESI-3 patients, followed by ESI 2 and ESI 4, which contributed 25% and 20% of the patient arrivals. Finally, ESI 1 and 5 each contributed only 2-3% of the total arrivals (See Table 1 below). Based on the ESI level of the patient, they would require multiple visits with a physician and nurse (See Table 1 below).
Table 1: Patient data.
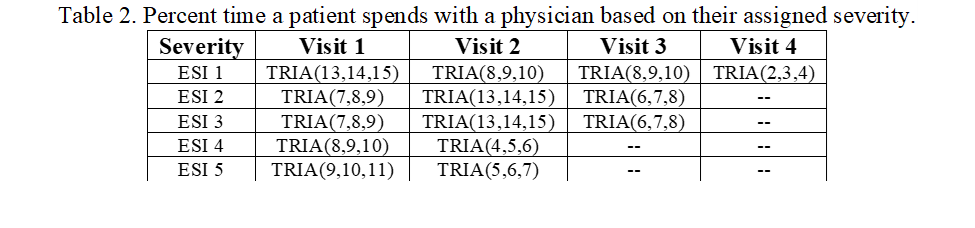
Additionally, each visit with a physician and nurse would take a different time based on the ESI level. The table below provides detail regarding how long each visit takes based on the ESI.
if the forecasted patient arrival into the Emergency department are as follow
Table 2. Percent time a patient spends with a physician based on their assigned severity. \\begin{tabular}{ll} \\( 2019-01-01 \\) 00:00:00 & 6.126855 \\\\ \\hline \\( 2019-01-0101: 00: 00 \\) & 5.956672 \\\\ \\hline \\( 2019-01-0102: 00: 00 \\) & 4.806865 \\\\ \\hline \\( 2019-01-0103: 00: 00 \\) & 5.823285 \\\\ \\hline \\( 2019-01-0104: 00: 00 \\) & 5.549459 \\\\ \\hline \\end{tabular} \\begin{tabular}{ll} \\hline \\( 2019-01-03 \\) 19:00:00 & 8.841514 \\\\ \\hline \\( 2019-01-03 \\) 20:00:00 & 8.447259 \\\\ \\hline \\( 2019-01-0321: 00: 00 \\) & 8.326179 \\\\ \\hline \\( 2019-01-0322: 00: 00 \\) & 8.309108 \\\\ \\hline \\( 2019-01-0323: 00: 00 \\) & 8.301131 \\\\ \\hline \\end{tabular} Freq: H, Length: 72, dtype: float64 \\begin{tabular}{|ll} \\hline \\( 2019-01-03 \\) 19:00:00 & 8.628203 \\\\ \\hline \\( 2019-01-0320: 00: 00 \\) & 8.594958 \\\\ \\hline \\( 2019-01-0321: 00: 00 \\) & 8.564343 \\\\ \\hline \\( 2019-01-0322: 00: 00 \\) & 8.538107 \\\\ \\hline \\( 2019-01-0323: 00: 00 \\) & 8.517536 \\\\ \\hline \\end{tabular} Freq: H, Length: 72, dtype: float64 Table 2. Percent time a patient spends with a physician based on their assigned severity. \\begin{tabular}{ll} \\( 2019-01-01 \\) 00:00:00 & 6.126855 \\\\ \\hline \\( 2019-01-0101: 00: 00 \\) & 5.956672 \\\\ \\hline \\( 2019-01-0102: 00: 00 \\) & 4.806865 \\\\ \\hline \\( 2019-01-0103: 00: 00 \\) & 5.823285 \\\\ \\hline \\( 2019-01-0104: 00: 00 \\) & 5.549459 \\\\ \\hline \\end{tabular} \\begin{tabular}{ll} \\hline \\( 2019-01-03 \\) 19:00:00 & 8.841514 \\\\ \\hline \\( 2019-01-03 \\) 20:00:00 & 8.447259 \\\\ \\hline \\( 2019-01-0321: 00: 00 \\) & 8.326179 \\\\ \\hline \\( 2019-01-0322: 00: 00 \\) & 8.309108 \\\\ \\hline \\( 2019-01-0323: 00: 00 \\) & 8.301131 \\\\ \\hline \\end{tabular} Freq: H, Length: 72, dtype: float64 \\begin{tabular}{|ll} \\hline \\( 2019-01-03 \\) 19:00:00 & 8.628203 \\\\ \\hline \\( 2019-01-0320: 00: 00 \\) & 8.594958 \\\\ \\hline \\( 2019-01-0321: 00: 00 \\) & 8.564343 \\\\ \\hline \\( 2019-01-0322: 00: 00 \\) & 8.538107 \\\\ \\hline \\( 2019-01-0323: 00: 00 \\) & 8.517536 \\\\ \\hline \\end{tabular} Freq: H, Length: 72, dtype: float64
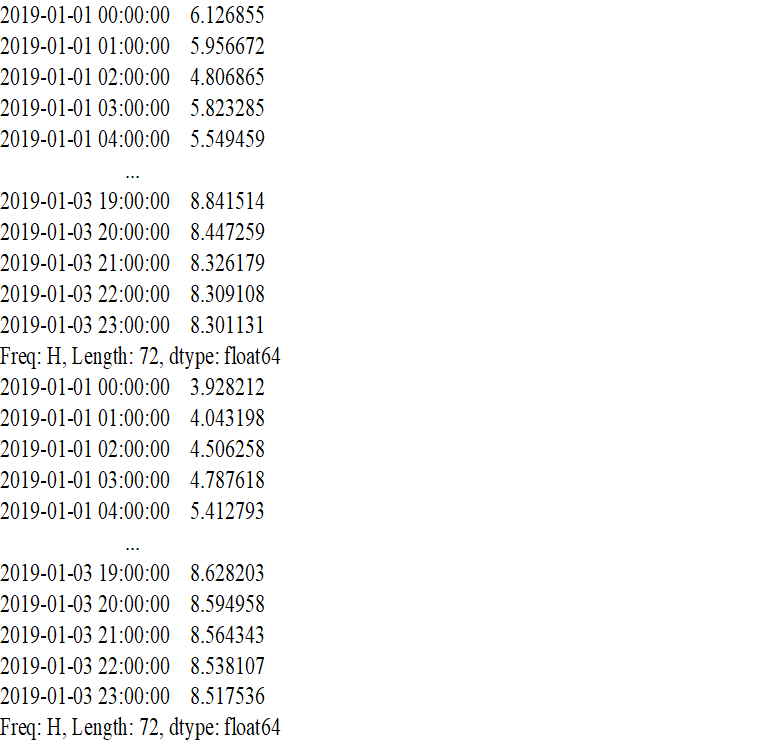
Step by Step Solution
There are 3 Steps involved in it
Step: 1
Get Instant Access to Expert-Tailored Solutions
See step-by-step solutions with expert insights and AI powered tools for academic success
Step: 2
Step: 3
Ace Your Homework with AI
Get the answers you need in no time with our AI-driven, step-by-step assistance
Get Started