

Answered step by step
Verified Expert Solution
Question
1 Approved Answer
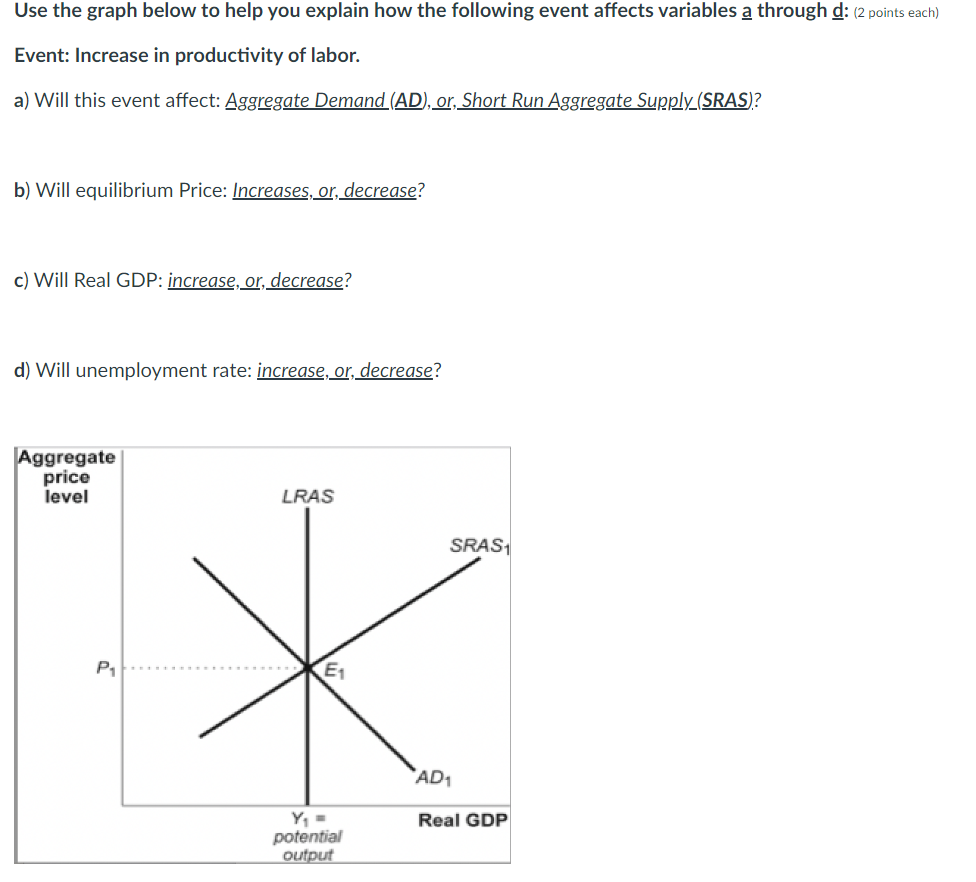
Use the graph below to help you explain how the following event affects variables a through d: (2 points each) Event: Increase in productivity of
Step by Step Solution
There are 3 Steps involved in it
Step: 1

Get Instant Access to Expert-Tailored Solutions
See step-by-step solutions with expert insights and AI powered tools for academic success
Step: 2

Step: 3
Ace Your Homework with AI
Get the answers you need in no time with our AI-driven, step-by-step assistance
Get Started
American Political Economy In Global Perspective
Authors: Harold L Wilensky
1st Edition
1139227920, 9781139227926