Question
Use the iloc() function to extract the first 20 features of the dataframe har_train. Save this new dataframe to first_twenty. Next, using the seaborn library
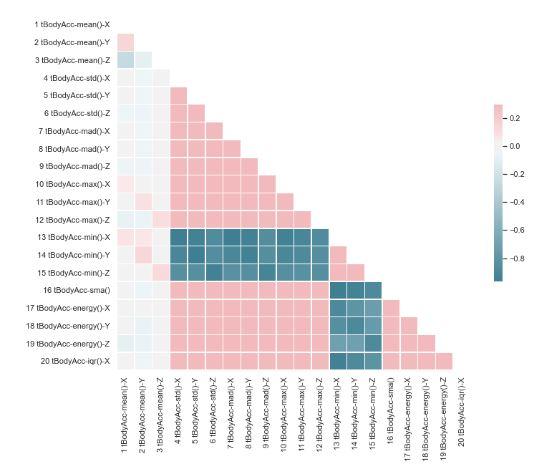
Use the iloc() function to extract the first 20 features of the dataframe har_train. Save this new dataframe to first_twenty. Next, using the seaborn library create a heatmap for the correlation matrix. First you have to create the correlation matrix from the pandas dataframe (save it in a dataframe called corr) and then plot it using seaborn with these customizations: Set the seaborn style to white. Generate a mask using np.triu(np.ones_like()) with the dtype as boolean to only show the lower triangle of the correlation matrix. Save it in a variable called mask. Set up the figure with matplotlib with figsize=(11,9). Use fig, ax = ... Generate a custom diverging colormap for the heatmap with the arguments (220, 10, as_cmap=True). Save it in a variable called cmap. Draw the heatmap with the mask and correct aspect ratio, using the arguments corr, mask=mask, cmap=cmap, vmax=.3, center=0, square=True, linewidths=.5, cbar_kws={"shrink": .5}). Finally, use fig.tight_layout() just before saving the plot to produce a nicely centered graph. You can find more information about how to create a heatmap using seaborn here. The final plot should look like this:


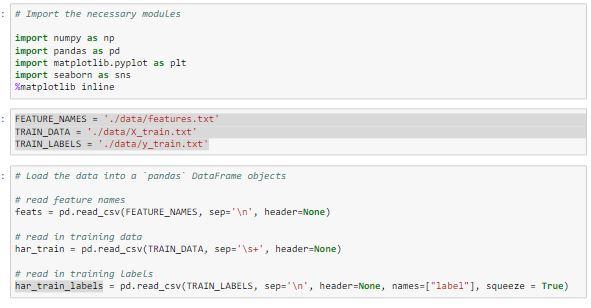
\# Import the necessary modules import numpy as np import pandas as pd import matplotlib.pyplot as plt import seaborn as sns Mmatplotlib inline FEATURE_NAMES = './ data/features, txt TRAIN_OATA =/ data/X_train.txt' TRAIN_LABELS =/ data/y_train.txt' * Load the data into a pandos DataFrame objects * read feature names feats = pd.read_cSV(FEATURE_NAMES, Sep ' ' n ', header=None) H read in training dato har_train = pd.read_csV(TRAIN_DATA, sep =\5t, header=None) * read in training Labels har_train_labels = pd. read_csv(TRAIN_LABELS, sep = " n, header=None, names=["label"], squeeze = True)
Step by Step Solution
There are 3 Steps involved in it
Step: 1

Get Instant Access to Expert-Tailored Solutions
See step-by-step solutions with expert insights and AI powered tools for academic success
Step: 2

Step: 3

Ace Your Homework with AI
Get the answers you need in no time with our AI-driven, step-by-step assistance
Get Started


