Answered step by step
Verified Expert Solution
Question
1 Approved Answer
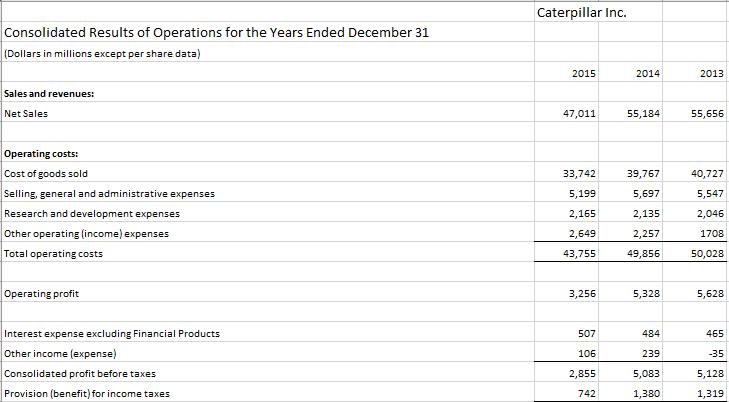
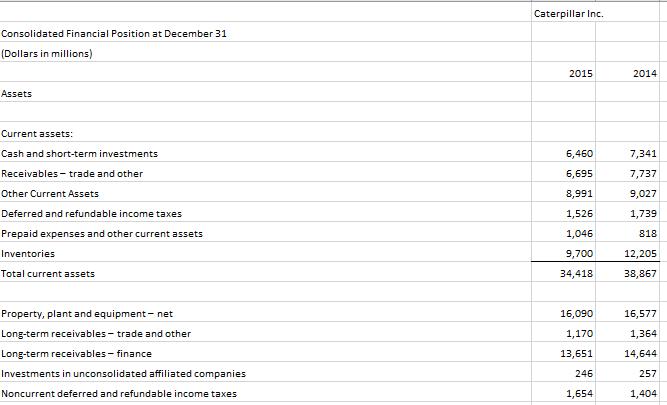
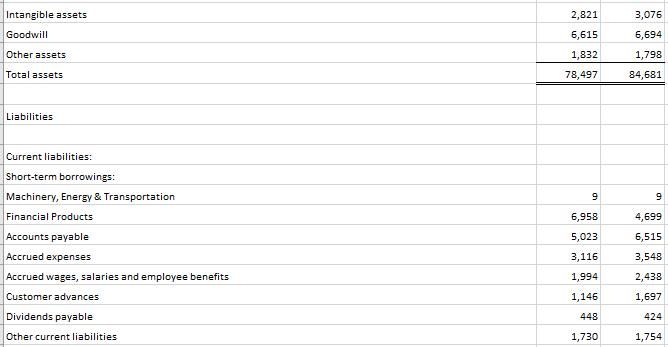
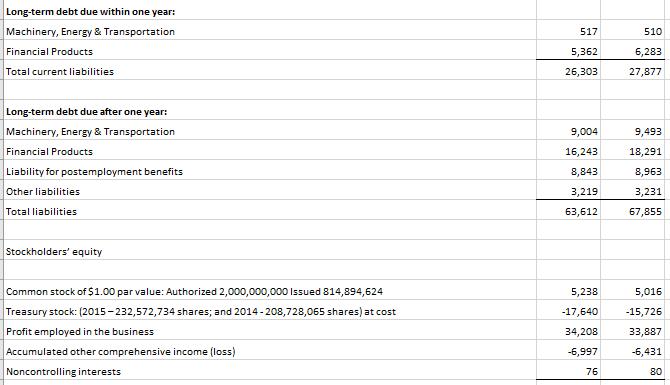
Use the Income Statement and Balance Sheet information to complete the project. 1. Prepare the vertical analysis. Analyze the results. Compare the years and look
Use the Income Statement and Balance Sheet information to complete the project.


1. Prepare the vertical analysis. Analyze the results. Compare the years and look for increases and decreases
2. Prepare the horizontal analysis. Analyze the results. Compare the years and look for increases and decreases
Consolidated Results of Operations for the Years Ended December 31 (Dollars in millions except per share data) Sales and revenues: Net Sales Operating costs: Cost of goods sold Selling, general and administrative expenses Research and development expenses Other operating (income) expenses Total operating costs Operating profit Interest expense excluding Financial Products Other income (expense) Consolidated profit before taxes Provision (benefit) for income taxes Caterpillar Inc. 2015 47,011 33,742 5,199 2,165 2,649 43,755 3,256 507 106 2,855 742 2014 55,184 39,767 5,697 2,135 2,257 49,856 5,328 484 239 5,083 1,380 2013 55,656 40,727 5,547 2,046 1708 50,028 5,628 465 -35 5,128 1,319
Step by Step Solution
There are 3 Steps involved in it
Step: 1
Vertical Evaluation In vertical analysis every line item in the financial statement is expressed as a percentage of a base number For the income statement and balance sheet this is usually total sales ...
Get Instant Access to Expert-Tailored Solutions
See step-by-step solutions with expert insights and AI powered tools for academic success
Step: 2

Step: 3

Ace Your Homework with AI
Get the answers you need in no time with our AI-driven, step-by-step assistance
Get Started


