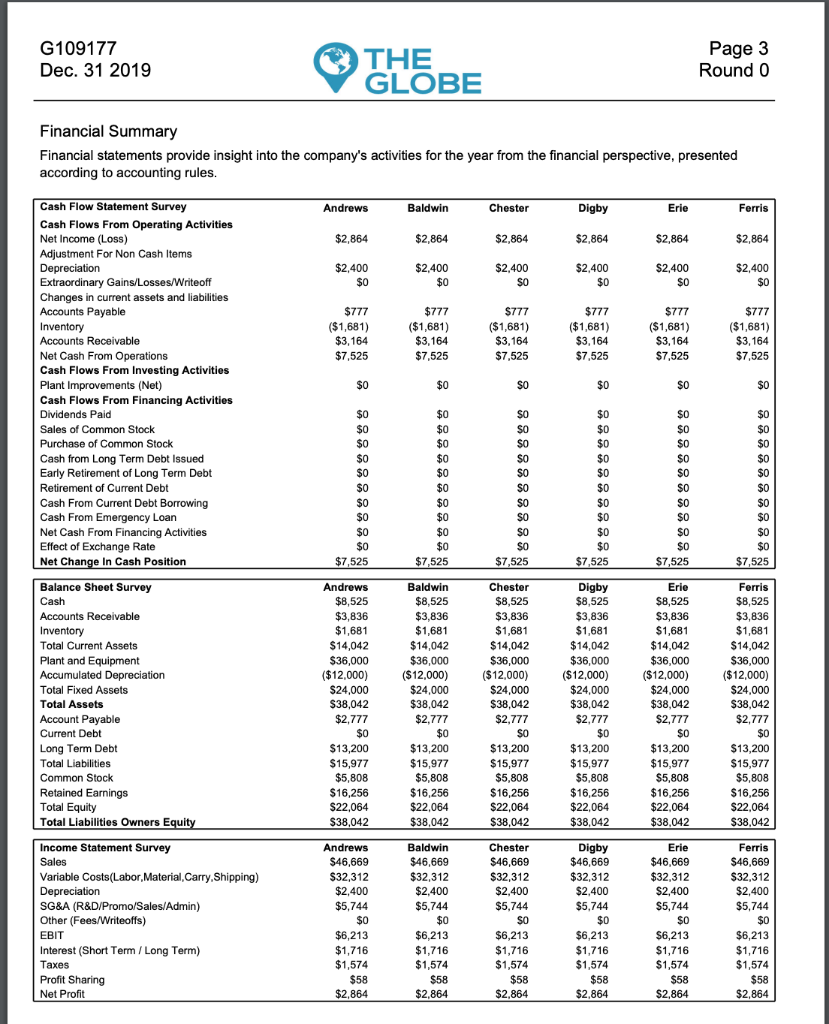
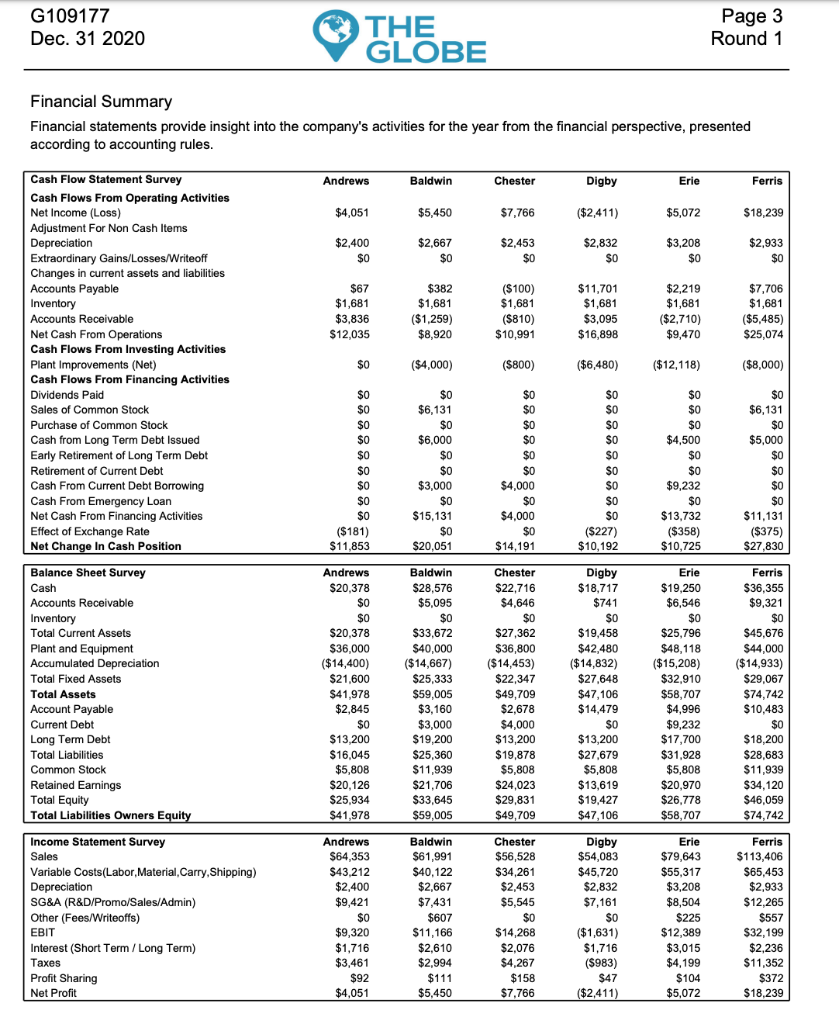
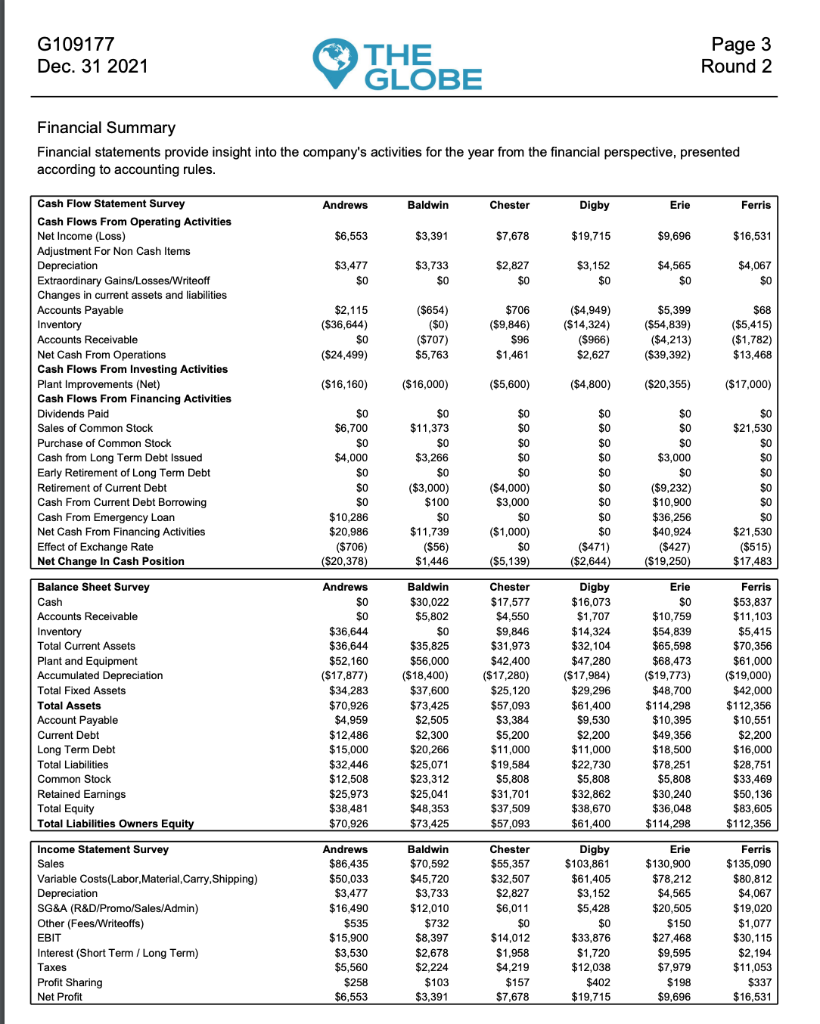
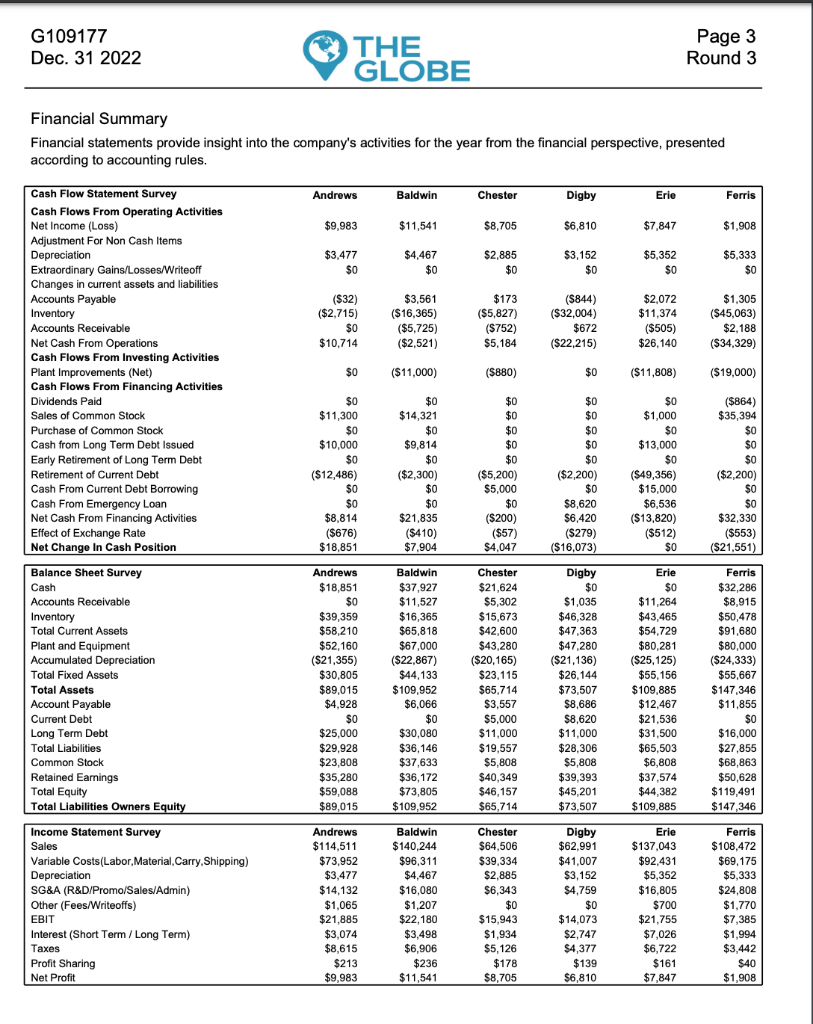
Use the information above, to fill out the excel sheet for these companies Andrews, Erie and Baldwin. (Please show calculation)
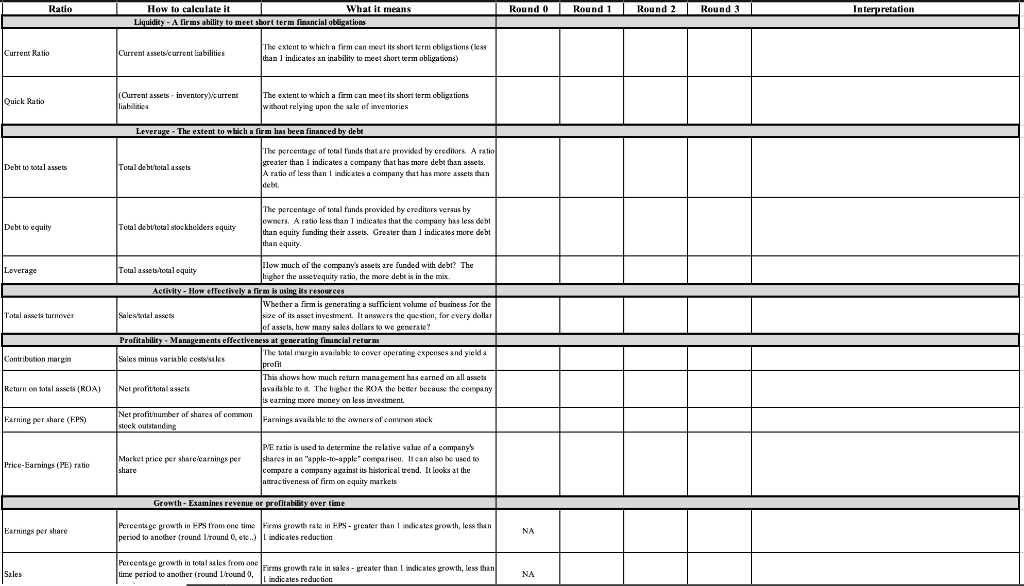
G109177 Page 3 Round 0 THE GLOBE Dec. 31 2019 Financial Summary Financial statements provide insight into the company's activities for the year from the financial perspective, presented according to accounting rules. Cash Flow Statement Survey Baldwin Digby Andrews Chester Erie Ferris Cash Flows From Operating Activities Net Income (Loss) $2.864 $2.864 $2,864 $2.864 $2,864 $2,864 Adjustment For Non Cash Items Depreciation Extraordinary Gains/Losses/Writeoff $2,400 $2,400 $2,400 SC $2.400 $2,400 $0 $2,400 $0 SC SC Changes in current assets and liabilities Accounts Payable Inventory Accounts Receivable Net Cash From Operations Cash Flows From Investing Activities $777 $777 ($1,681) $3,164 $7,525 S777 $777 $777 $777 ($1,681) ($1,681) $3,164 $7,525 ($1,681) $3,164 ($1,681) $3,164 $7,525 ($1,681) $3,164 $7,525 $3.164 $7,525 $7,525 $0 $0 $0 $0 $0 ents (Net) rom Financing Activities Cash Ele Dividends Paid SC so $0 $0 Sales of Common Stock S0 $0 $0 $0 $0 Purchase of Common Stock Cash from Long Term Debt Issued Early Retirement of Long Term Debt $0 $0 $0 $0 $0 $0 $0 $0 S0 S0 $0 $0 $0 $0 SC S0 $0 $0 $0 $0 SC $S0 $0 $0 S0 Retirement of Current Debt S0 Cash From Current Debt Borrowing Cash From Emergency Loan Net Cash From Financing Activities Effect of Exchange Rate S0 $0 $0 $S0 S0 S0 $0 SC SC $0 $0 $0 $0 $0 S0 $0 SC SC $0 $0 Net Change In Cash Position $7,525 $7,525 $7,525 $7,525 $7,525 $7,525 Balance Sheet Survey Ferris Andrews Baldwin Chester Digby Erie Cash $8.525 $8,525 $3,836 $1,681 $8,525 $8,525 $8,525 $8,525 $3,836 $1,681 Accounts Receivable $3.836 $3,836 $3,836 $1,681 $3.836 Inventory $1,681 $1,681 $1,681 Total Current Assets $14,042 $14,042 $14,042 $14,042 $36,000 ($12,000) $24,000 $38,042 $14,042 $14,042 Plant and Equipment Accumulated Depreciation $36,000 $36,000 $36.000 $36,000 $36,000 ($12,000) $24,000 ($12,000) $24,000 $38,042 $2,777 ($12,000) $24,000 ($12,000) $24,000 $38,042 ($12,000) $24.000 Total Fixed Assets Total Assets $38,042 $38,042 $38,042 $2,777 Account Payable $2,777 $2,777 $2,777 $2,777 Current Debt $13. Debt $13.2 $13 200 $13 200 $13.200 $13.200 Total Liabilities Common Stock $15,977 $15,977 $15,977 $15,977 $15,977 $15.977 $5,808 $5,808 $5,808 $16,256 $22.064 $5,808 $16,256 $22,064 $5,808 $16,256 $22,064 $5,808 $16,256 $22,064 $38,042 $16,256 $16,256 Retained Earnings Total Equity $22,064 $22,064 Total Liabilities Owners Equity $38.042 $38.042 $38.042 $38.042 $38.042 Income Statement Survey Andrews Baldwin Chester Digby $46,669 Ferris Erie Sales $46,669 $32,312 $2,400 $46,669 $46,669 S40,009 H0,008 Variable Costs(Labor,Material,Carry,Shipping) $32,312 $32,312 $32,312 $32.312 $32,312 Depreciation $2,400 $5,744 $2,400 $5,744 $2,400 $2,400 $2,400 aboosales/Admin) (Fees/Writeoffs) $5. $5. S5, $5. EBIT $6,213 $6,213 $6,213 $6,213 $6,213 $6,213 Interest (Short Term / Long Term) $1,716 $1,716 $1,716 $1,716 $1,716 $1,716 Taxes $1,574 $1,574 $1,574 $1,574 $1,574 $1,574 $58 Profit Sharing $58 $58 $58 $58 $58 Net Profit $2,864 $2.864 S2.864 S2.864 $2.864 $2.864 G109177 Page 3 Round 1 THE GLOBE Dec. 31 2020 Financial Summary Financial statements provide insight into the company's activities for the year from the financial perspective, presented according to accounting rules. Cash Flow Statement Survey Chester Andrews Baldwin Digby Erie Ferris Cash Flows From Operating Activities Net Income (Loss) $5,072 $4,051 $5,450 $7,766 ($2,411) $18,239 Adjustment For Non Cash Items $2,400 $0 $2,667 $2,453 $2,832 $3,208 $2,933 Depreciation S0 S0 Extraordinary Gains/Losses/Writeoff Changes in current assets and liabilities Payable S0 SC S0 $67 $382 ($100) $1,681 ($810) $10,991 $11,701 $1,681 $2,219 $1.681 $7,706 $1.681 $1,681 $1,681 Inventory Accounts Receivable $3,836 $12,035 ($1,259) $8,920 $3,095 ($2,710) $9,470 ($5,485) Net Cash From Operations $16,898 $25,074 Cash Flows From Investing Activities Plant Improvements (Net) Cash Flows From Financing Activities S0 ($4,000) (S800) ($6,480) ($12,118) ($8,000) $0 SC $0 S0 S0 $0 Dividends Paid S0 $0 Sales of Common Stock $6,131 S0 S0 $6,131 S0 S0 S0 SC S0 SC Purchase of Common Stock Cash from Long Term Debt Issued S0 $6,000 SC S0 $4,500 $5,000 Early Retirement of Long Term Debt Retirement of Current Debt Cash From Current Debt Borrowing SO S0 S0 S0 S0 S0 $0 $0 $0 $0 S0 $S0 SC $3,000 $4,000 S0 $9,232 S0 S0 S0 S0 S0 SC S0 Cash From Emergency Loan Net Cash From Financing Activities Effect of Exchange Rate Net Change In Cash Position S0 $15.131 $4,000 S0 $13,732 $11,131 ($375) $27,830 ($227) ($181) S0 ($358) S0 $11.853 $20,051 $14,191 $10,192 $10,725 Balance Sheet Survey Baldwin Chester Ferris Andrews Erie by $1871 Cash $20 378 $28,576 $22.716 $19.250 $36,355 Accounts Receivable $0 $5,095 $4.646 $741 $6,546 $9,321 S0 S0 S0 $0 $25,796 $0 $45,676 Inventory Total Current Assets $20,378 $33,672 $27,362 $19,458 Plant and Equipment $36,000 $40,000 ($14,667 $36,800 ($14,453) $42,480 ($14,832) $48,118 $44,000 ($14,933) ($14,400) ($15,208) Accumulated Depreciation Total Fixed Assets $21,600 $25,333 $22,347 $27,648 $47,106 $14,479 $32.910 $29,067 $49,709 $58.707 Total Assets $41,978 $59,005 $74,742 Account Payable $2,845 $3,160 $2.678 $4,996 $10,483 Current Debt SO $3,000 $4,000 S0 $9,232 $19,200 $13,200 $13,200 Long Term Debt $13,200 $17,700 $31,928 $5,808 $20,970 $26,778 $58,707 $18,200 $19,878 $5,808 Total Liabilities $16,045 $5,808 $25,360 $27,679 $28.683 Common Stock $11,939 $5,808 $11.939 Retained Earmings $20.126 $21,706 $33,645 $24.023 $13,619 $34.120 $25,934 $29,831 $19,427 $46,059 Total Equity Total Liabilities Owners Equity $41,978 $59,005 $49,709 $47,106 $74,742 Income Statement Survey Baldwin Andrews Chester Digby $54,083 $45,720 $2,832 $7,161 Erie Ferris Sales $64,353 $43,212 $2,400 $9,421 $61,991 $40,122 $2,667 $7,431 $56,528 $79,643 $113,406 Variable Costs(Labor, Material, Carry,Shipping) Depreciation SG&A (R&D/Promo/Sales/Admin) Other (Fees/Writeoffs) $34,261 $55,317 $65,453 $2,453 $3.208 $2,933 $5,545 $8,504 $12,265 S0 $0 $607 $11,166 $2,610 S0 $225 $557 $9,320 EBIT $14,268 $2,076 ($1,631) $1,716 ($983) $12.389 $32,199 $2,236 $11,352 Interest (Short Term / Long Term) $1.716 $3.015 Taxes $3.461 $2.994 $4,267 $4.199 $92 $111 $158 S47 $104 $372 Profit Sharing Net Profit $4.051 $5.450 $7.766 ($2,411) $5,072 $18,239 *** G109177 Page 3 Round 2 THE GLOBE Dec. 31 2021 Financial Summary Financial statements provide insight into the company's activities for the year from the financial perspective, presented according to accounting rules. Cash Flow Statement Survey Baldwin Digby Ferris Andrews Chester Erie Cash Flows From Operating Activities Net Income (Loss) $6,553 $3.391 $7.678 $19,715 $9,696 $16,531 Adjustment For Non Cash Items Depreciation Extraordinary Gains/Losses/Writeoff Changes in current assets and liabilities Accounts Payable Inventory $3,477 $3,733 S0 $2.827 $3.152 $4.565 $4,067 SC SC $0 $2,115 ($36,644) ($654) ($0) ($707) $706 ($4,949) ($14,324) ($966) $5.399 $68 ($5,415) ($1,782) $13,468 ($9,846) ($54,839) Accounts Receivable $96 ($4,213) ($39,392) Net Cash From Operations Flows From ($24,499) $5,763 $1,461 $2,627 ting Activities ($4,800) ($16,160) ($16,000) ($20,355) Plant ($5,600) ($17,000) Cash Flows From Financing Activities. Dividends Paid S0 S0 $0 $0 $0 $6.700 $11,373 $0 $0 $0 $21,530 $0 Sales of Common Stock Purchase of Common Stock Cash from Long Term Debt Issued Early Retirement of Long Term Debt Retirement of Current Debt Cash From Current Debt Borrowing Cash From Emergency Loan Net Cash From Financing Activities SC S0 S0 $0 S0 $4,000 $3,266 S0 $0 $3,000 $0 SC S0 $0 $0 $0 S0 ($3,000) $100 ($4,000) $0 ($9,232) $10.900 $0 S0 $0 $0 $3,000 $10,286 $0 $36.256 S0 SC $20,986 $11,739 ($56) $1,446 ($1,000) $0 $40,924 $21,530 Effect of Exchange Rate Net Change In Cash Position ($706) $0 ($471) ($2,644) ($427) ($19,250) ($515) $17,483 ($20.378) (S5,139) Baldwin Balance Sheet Survey Digby $16,073 Ferris Andrews Chester Erie SC $30,022 $17,577 $0 $53,837 Cash Accounts Receivable SC $5,802 $4,550 $1,707 $10,759 $11,103 Inventory Total Current Assets Plant and Equipment Accumulated Depreciation $36,644 S0 $9,846 $31,973 $42,400 ($17,280) $14,324 $54,839 $5,415 $70.356 $36.644 $35,825 $56,000 ($18,400) $37,600 $73,425 $2,505 $2,300 $32,104 $47,280 $65.598 $52.160 $68,473 $61,000 ($19,000) $42,000 $112,356 $10,551 $2,200 ($17,877) $34,283 $70,926 $4,959 $12,486 ($17,984) ($19,773) Total Fixed Assets $25,120 $29,296 $61,400 $9,530 $2,200 $48,700 $114,298 $10,395 $49,356 Total Assets $57,093 Account Payable $3,384 $5,200 Current Debt Long Term Debt $16 noo'er $33,469 t22 730 00n'CLt $19.584 Common Stock $12,508 $25,973 $23,312 $25,041 $5,808 $31,701 $37,509 $5,808 $32,862 $38,670 $5,808 $30,240 Retained Earnings $50,136 Total Equity Total Liabilities Owners Equity $38,481 $48.353 $36,048 $83,605 $70,926 $73.425 $57,093 $61.400 $114.298 $112,356 Income Statement Survey Sales Andrews Baldwin Chester Digby $103,861 $61,405 Erie Ferris $86,435 $50,033 $70,592 $45,720 $3,733 $55,357 $130,900 $135,090 $80,812 $4,067 $19,020 Variable Costs(Labor, Material,Carry,Shipping) $32,507 $78,212 $4,565 Depreciation SG&A (R&D/Promo/Sales/Admin) Other (Fees/Writeoffs) EBIT $3,477 $2,827 $3,152 $20.505 $16,490 $12,010 $6,011 $5,428 $535 $732 $0 $0 $150 $1,077 $15,9 $8,397 $33,876 $14,012 $30,115 89t'/Zt t (Short Term / Long Term) $12.038 Taxes $5.560 $2.224 $4,219 $7,979 $11,053 Profit Sharing $258 $103 $157 $402 $198 $337 $3,391 Net Profit $6.553 $7,678 $19.715 $9,696 $16.531 G109177 Page 3 Round 3 THE GLOBE Dec. 31 2022 Financial Summary Financial statements provide insight into the company's activities for the year from the financial perspective, presented according to accounting rules. Cash Flow Statement Survey Andrews Baldwin Chester Digby Erie Ferris Cash Flows From Operating Activities Net Income (Loss) $9.983 $6,810 $1.908 $11,541 s8.705 $7.847 Non Cash Items Depreciation $3,477 $4,467 $0 $2.885 $3.152 $5.352 $5,333 S0 Extraordinary Gains/Losses/Writeoff Changes in current assets and liabilities Accounts Payable Inventory $0 $0 $0 SC (S321 $3,561 ($16,365) ($5,725) ($2,521) $173 ($5,827) ($752) $5,184 (S844) $2,072 $1,305 ($2,715) $11.374 ($32,004) ($45,063) $0 $672 ($505) $26,140 $2,188 ($34,329) Accounts Receivable $10,714 Net Cash From Operations Cash Flows From Investing Activities Plant Improvements (Net) Cash Flows From Financing Activities ($22,215) $0 $0 ($11,000) ($880) ($11,808) ($19,000) $0 $0 $0 so ($864) Sales of Common Stock $11.300 $14,321 tn en $1,000 $35,394 Purchase of Common Stock so $0 $0 $0 $0 Cash from Long Term Debt Issued Early Retirement of Long Term Debt Retirement of Current Debt Cash From Current Debt Borrowing Cash From Emergency Loan $10,000 $9,814 $0 $0 $13,000 SC $0 $0 S0 $0 $0 $0 ($12,486) ($2,300) $0 ($5,200) $5.000 ($2,200) $0 ($49,356) $15,000 $6,536 ($13,820) ($512) ($2,200) $0 $0 $0 $8,620 $6,420 ($279) (S16,073) $0 $8.814 ($676) $18.851 $21.835 ($200) $32,330 ($553) ($21,551) Net Cash From Financing Activities Effect of Exchange Rate Net Change In Cash Position ($410) $7,904 ($57) $4,047 Baldwin Balance Sheet Survey Chester Digby Erie Ferris Andrews Cash $18.851 $37,927 $21.624 $32.286 $0 $11,527 $16,365 $65,818 $5,302 $15,673 $42,600 $43,280 ($20,165) $1,035 $11,264 $43,465 $54,729 $8,915 Accounts Receivable Inventory Total Current Assets $39,359 $46,328 $50,478 $58.210 $47,363 $47,280 ($21,136) $91,680 $80,000 ($24,333) $55,667 $147,346 $11,855 $0 Plant and Equipment $52,160 $67,000 $80,281 ($25,125) Accumulated Depreciation ($21,355) $30,805 $89,015 $4,928 $0 ($22,867) $44,133 $109,952 $6,066 $0 Total Fixed Assets $23.115 $26.144 $55,156 $109,885 $12,467 $21,536 $65,714 $3,557 $5,000 $73.507 Total Assets $8,686 $8,620 Account Payable Current Debt $25 $30 $16 . T mDebt e20 928 $36,146 $28.306 $65.503 $19.557 $27.855 Common Stock $23,808 $37,633 $5,808 $5,808 $6,808 $68,863 Retained Eamings Total Equity Total Liabilities Owners Equity $35,280 $59,088 $36,172 $40,349 $39,393 $45,201 $37,574 $50,628 $119,491 $73,805 $46,157 $44,382 $89,015 $109.952 $65.714 $73.507 $109.885 $147,346 Income Statement Survey Andrews Baldwin Chester Digby $62,991 Erie Ferris $114,511 $140,244 $137,043 $108,472 Sales $64,506 Costs(Labor,Material,Carry,Shipping) $2.885 $3,152 Depreciation $3.477 $4,467 $5,352 5,333 $16,080 $16,805 $24,808 SG&A (R&D/Promo/Sales/Admin) Fees/Writeoffs) $14,132 $6,343 $4,759 EBIT $21,885 $22.180 $15.943 $14.073 $21,755 $7.385 Interest (Short Term / Long Term) $2,747 $3,074 $3,498 $6,906 $1,934 $7,026 $1.994 Taxes $8,615 $5,126 $4.377 $6.722 $3,442 $236 $139 Profit Sharing Net Profit $213 $178 $161 $40 $9.983 $11.541 s8.705 $6.810 $7.847 $1.908 Ratio How to calculate it Round 1 Round 2 Round 3 What it means Round 0 Interpretation Liquidity- A firms ability to meet short term financial obligations The extent to which a firm can meet its short term obligations (ess than 1 indicates an inability to meet short term obligations) Current assetseurrent liabilities Current Ratio (Current assets-inventorycurren linbilities The extent to which a firm can meet its short term cbligations without relying upon t Quick Ratio sale of inventories Leveruge The extent to which a firm has been financed by debt The percentage of total funds that are provided by creditors. A ratio Debt to total assets Tetal debttotal assets debt. of total funds provided by cred ewners A ratio less than 1 indicates that the company has less debt Teal debutotal stockholders equity Debt to equity than equity fumding their assets Greater than 1 indicatesmore debt than equity How much of the company's assets higher e funded with debt? The Leverage Total assets total equity assetequity ratio, the more debe is in the mix Activity How effectively a f is using its resour ces ting a sufficient volume of basiness for the size of its asset invesment. It answers the question, for every dollar Salestotal assets Total assets turnever of assets, how many sakes dollars to we generate? Profitability- Managements effectiveness at generating financial returns r xpenses and yield a tal margin available to cover operating refit Contribution margin Sales minus variable costs'ssles This shows how much return management has earned on all assets Net profittotal asscts. Return on total assets (ROA) availa ble to . The ligher the ROA the beter because the comeany gmore money on less investment Net profitnumber of shares of common Farnings available to the owners of eommon stock Earning per share (EPS) stock outstanding PVE ratio is used to determine the relative value of a company's shares in an "apple-to-apple" comparison. Itcan also be used to compare a company against its historical trend, It leoks at the |attractiveness of firm on equity markets Market price per sharelcarnings per share Price-Earnings (PE) ratio Growth- Examines revenue or profitability over time ereenta ge prowth in HPS from one time Firms erowth neriod to ancther (round lround 0, e.. EPS- ereater than 1 indicates prowth, less than Earnings per share NA Lindicates reduction Pereentage growth in total sales from on time period to another (round 1reund 0 Firms growth rate in sakes- greater than l indicates growth, less than. Lindic ates reduction Sale NA G109177 Page 3 Round 0 THE GLOBE Dec. 31 2019 Financial Summary Financial statements provide insight into the company's activities for the year from the financial perspective, presented according to accounting rules. Cash Flow Statement Survey Baldwin Digby Andrews Chester Erie Ferris Cash Flows From Operating Activities Net Income (Loss) $2.864 $2.864 $2,864 $2.864 $2,864 $2,864 Adjustment For Non Cash Items Depreciation Extraordinary Gains/Losses/Writeoff $2,400 $2,400 $2,400 SC $2.400 $2,400 $0 $2,400 $0 SC SC Changes in current assets and liabilities Accounts Payable Inventory Accounts Receivable Net Cash From Operations Cash Flows From Investing Activities $777 $777 ($1,681) $3,164 $7,525 S777 $777 $777 $777 ($1,681) ($1,681) $3,164 $7,525 ($1,681) $3,164 ($1,681) $3,164 $7,525 ($1,681) $3,164 $7,525 $3.164 $7,525 $7,525 $0 $0 $0 $0 $0 ents (Net) rom Financing Activities Cash Ele Dividends Paid SC so $0 $0 Sales of Common Stock S0 $0 $0 $0 $0 Purchase of Common Stock Cash from Long Term Debt Issued Early Retirement of Long Term Debt $0 $0 $0 $0 $0 $0 $0 $0 S0 S0 $0 $0 $0 $0 SC S0 $0 $0 $0 $0 SC $S0 $0 $0 S0 Retirement of Current Debt S0 Cash From Current Debt Borrowing Cash From Emergency Loan Net Cash From Financing Activities Effect of Exchange Rate S0 $0 $0 $S0 S0 S0 $0 SC SC $0 $0 $0 $0 $0 S0 $0 SC SC $0 $0 Net Change In Cash Position $7,525 $7,525 $7,525 $7,525 $7,525 $7,525 Balance Sheet Survey Ferris Andrews Baldwin Chester Digby Erie Cash $8.525 $8,525 $3,836 $1,681 $8,525 $8,525 $8,525 $8,525 $3,836 $1,681 Accounts Receivable $3.836 $3,836 $3,836 $1,681 $3.836 Inventory $1,681 $1,681 $1,681 Total Current Assets $14,042 $14,042 $14,042 $14,042 $36,000 ($12,000) $24,000 $38,042 $14,042 $14,042 Plant and Equipment Accumulated Depreciation $36,000 $36,000 $36.000 $36,000 $36,000 ($12,000) $24,000 ($12,000) $24,000 $38,042 $2,777 ($12,000) $24,000 ($12,000) $24,000 $38,042 ($12,000) $24.000 Total Fixed Assets Total Assets $38,042 $38,042 $38,042 $2,777 Account Payable $2,777 $2,777 $2,777 $2,777 Current Debt $13. Debt $13.2 $13 200 $13 200 $13.200 $13.200 Total Liabilities Common Stock $15,977 $15,977 $15,977 $15,977 $15,977 $15.977 $5,808 $5,808 $5,808 $16,256 $22.064 $5,808 $16,256 $22,064 $5,808 $16,256 $22,064 $5,808 $16,256 $22,064 $38,042 $16,256 $16,256 Retained Earnings Total Equity $22,064 $22,064 Total Liabilities Owners Equity $38.042 $38.042 $38.042 $38.042 $38.042 Income Statement Survey Andrews Baldwin Chester Digby $46,669 Ferris Erie Sales $46,669 $32,312 $2,400 $46,669 $46,669 S40,009 H0,008 Variable Costs(Labor,Material,Carry,Shipping) $32,312 $32,312 $32,312 $32.312 $32,312 Depreciation $2,400 $5,744 $2,400 $5,744 $2,400 $2,400 $2,400 aboosales/Admin) (Fees/Writeoffs) $5. $5. S5, $5. EBIT $6,213 $6,213 $6,213 $6,213 $6,213 $6,213 Interest (Short Term / Long Term) $1,716 $1,716 $1,716 $1,716 $1,716 $1,716 Taxes $1,574 $1,574 $1,574 $1,574 $1,574 $1,574 $58 Profit Sharing $58 $58 $58 $58 $58 Net Profit $2,864 $2.864 S2.864 S2.864 $2.864 $2.864 G109177 Page 3 Round 1 THE GLOBE Dec. 31 2020 Financial Summary Financial statements provide insight into the company's activities for the year from the financial perspective, presented according to accounting rules. Cash Flow Statement Survey Chester Andrews Baldwin Digby Erie Ferris Cash Flows From Operating Activities Net Income (Loss) $5,072 $4,051 $5,450 $7,766 ($2,411) $18,239 Adjustment For Non Cash Items $2,400 $0 $2,667 $2,453 $2,832 $3,208 $2,933 Depreciation S0 S0 Extraordinary Gains/Losses/Writeoff Changes in current assets and liabilities Payable S0 SC S0 $67 $382 ($100) $1,681 ($810) $10,991 $11,701 $1,681 $2,219 $1.681 $7,706 $1.681 $1,681 $1,681 Inventory Accounts Receivable $3,836 $12,035 ($1,259) $8,920 $3,095 ($2,710) $9,470 ($5,485) Net Cash From Operations $16,898 $25,074 Cash Flows From Investing Activities Plant Improvements (Net) Cash Flows From Financing Activities S0 ($4,000) (S800) ($6,480) ($12,118) ($8,000) $0 SC $0 S0 S0 $0 Dividends Paid S0 $0 Sales of Common Stock $6,131 S0 S0 $6,131 S0 S0 S0 SC S0 SC Purchase of Common Stock Cash from Long Term Debt Issued S0 $6,000 SC S0 $4,500 $5,000 Early Retirement of Long Term Debt Retirement of Current Debt Cash From Current Debt Borrowing SO S0 S0 S0 S0 S0 $0 $0 $0 $0 S0 $S0 SC $3,000 $4,000 S0 $9,232 S0 S0 S0 S0 S0 SC S0 Cash From Emergency Loan Net Cash From Financing Activities Effect of Exchange Rate Net Change In Cash Position S0 $15.131 $4,000 S0 $13,732 $11,131 ($375) $27,830 ($227) ($181) S0 ($358) S0 $11.853 $20,051 $14,191 $10,192 $10,725 Balance Sheet Survey Baldwin Chester Ferris Andrews Erie by $1871 Cash $20 378 $28,576 $22.716 $19.250 $36,355 Accounts Receivable $0 $5,095 $4.646 $741 $6,546 $9,321 S0 S0 S0 $0 $25,796 $0 $45,676 Inventory Total Current Assets $20,378 $33,672 $27,362 $19,458 Plant and Equipment $36,000 $40,000 ($14,667 $36,800 ($14,453) $42,480 ($14,832) $48,118 $44,000 ($14,933) ($14,400) ($15,208) Accumulated Depreciation Total Fixed Assets $21,600 $25,333 $22,347 $27,648 $47,106 $14,479 $32.910 $29,067 $49,709 $58.707 Total Assets $41,978 $59,005 $74,742 Account Payable $2,845 $3,160 $2.678 $4,996 $10,483 Current Debt SO $3,000 $4,000 S0 $9,232 $19,200 $13,200 $13,200 Long Term Debt $13,200 $17,700 $31,928 $5,808 $20,970 $26,778 $58,707 $18,200 $19,878 $5,808 Total Liabilities $16,045 $5,808 $25,360 $27,679 $28.683 Common Stock $11,939 $5,808 $11.939 Retained Earmings $20.126 $21,706 $33,645 $24.023 $13,619 $34.120 $25,934 $29,831 $19,427 $46,059 Total Equity Total Liabilities Owners Equity $41,978 $59,005 $49,709 $47,106 $74,742 Income Statement Survey Baldwin Andrews Chester Digby $54,083 $45,720 $2,832 $7,161 Erie Ferris Sales $64,353 $43,212 $2,400 $9,421 $61,991 $40,122 $2,667 $7,431 $56,528 $79,643 $113,406 Variable Costs(Labor, Material, Carry,Shipping) Depreciation SG&A (R&D/Promo/Sales/Admin) Other (Fees/Writeoffs) $34,261 $55,317 $65,453 $2,453 $3.208 $2,933 $5,545 $8,504 $12,265 S0 $0 $607 $11,166 $2,610 S0 $225 $557 $9,320 EBIT $14,268 $2,076 ($1,631) $1,716 ($983) $12.389 $32,199 $2,236 $11,352 Interest (Short Term / Long Term) $1.716 $3.015 Taxes $3.461 $2.994 $4,267 $4.199 $92 $111 $158 S47 $104 $372 Profit Sharing Net Profit $4.051 $5.450 $7.766 ($2,411) $5,072 $18,239 *** G109177 Page 3 Round 2 THE GLOBE Dec. 31 2021 Financial Summary Financial statements provide insight into the company's activities for the year from the financial perspective, presented according to accounting rules. Cash Flow Statement Survey Baldwin Digby Ferris Andrews Chester Erie Cash Flows From Operating Activities Net Income (Loss) $6,553 $3.391 $7.678 $19,715 $9,696 $16,531 Adjustment For Non Cash Items Depreciation Extraordinary Gains/Losses/Writeoff Changes in current assets and liabilities Accounts Payable Inventory $3,477 $3,733 S0 $2.827 $3.152 $4.565 $4,067 SC SC $0 $2,115 ($36,644) ($654) ($0) ($707) $706 ($4,949) ($14,324) ($966) $5.399 $68 ($5,415) ($1,782) $13,468 ($9,846) ($54,839) Accounts Receivable $96 ($4,213) ($39,392) Net Cash From Operations Flows From ($24,499) $5,763 $1,461 $2,627 ting Activities ($4,800) ($16,160) ($16,000) ($20,355) Plant ($5,600) ($17,000) Cash Flows From Financing Activities. Dividends Paid S0 S0 $0 $0 $0 $6.700 $11,373 $0 $0 $0 $21,530 $0 Sales of Common Stock Purchase of Common Stock Cash from Long Term Debt Issued Early Retirement of Long Term Debt Retirement of Current Debt Cash From Current Debt Borrowing Cash From Emergency Loan Net Cash From Financing Activities SC S0 S0 $0 S0 $4,000 $3,266 S0 $0 $3,000 $0 SC S0 $0 $0 $0 S0 ($3,000) $100 ($4,000) $0 ($9,232) $10.900 $0 S0 $0 $0 $3,000 $10,286 $0 $36.256 S0 SC $20,986 $11,739 ($56) $1,446 ($1,000) $0 $40,924 $21,530 Effect of Exchange Rate Net Change In Cash Position ($706) $0 ($471) ($2,644) ($427) ($19,250) ($515) $17,483 ($20.378) (S5,139) Baldwin Balance Sheet Survey Digby $16,073 Ferris Andrews Chester Erie SC $30,022 $17,577 $0 $53,837 Cash Accounts Receivable SC $5,802 $4,550 $1,707 $10,759 $11,103 Inventory Total Current Assets Plant and Equipment Accumulated Depreciation $36,644 S0 $9,846 $31,973 $42,400 ($17,280) $14,324 $54,839 $5,415 $70.356 $36.644 $35,825 $56,000 ($18,400) $37,600 $73,425 $2,505 $2,300 $32,104 $47,280 $65.598 $52.160 $68,473 $61,000 ($19,000) $42,000 $112,356 $10,551 $2,200 ($17,877) $34,283 $70,926 $4,959 $12,486 ($17,984) ($19,773) Total Fixed Assets $25,120 $29,296 $61,400 $9,530 $2,200 $48,700 $114,298 $10,395 $49,356 Total Assets $57,093 Account Payable $3,384 $5,200 Current Debt Long Term Debt $16 noo'er $33,469 t22 730 00n'CLt $19.584 Common Stock $12,508 $25,973 $23,312 $25,041 $5,808 $31,701 $37,509 $5,808 $32,862 $38,670 $5,808 $30,240 Retained Earnings $50,136 Total Equity Total Liabilities Owners Equity $38,481 $48.353 $36,048 $83,605 $70,926 $73.425 $57,093 $61.400 $114.298 $112,356 Income Statement Survey Sales Andrews Baldwin Chester Digby $103,861 $61,405 Erie Ferris $86,435 $50,033 $70,592 $45,720 $3,733 $55,357 $130,900 $135,090 $80,812 $4,067 $19,020 Variable Costs(Labor, Material,Carry,Shipping) $32,507 $78,212 $4,565 Depreciation SG&A (R&D/Promo/Sales/Admin) Other (Fees/Writeoffs) EBIT $3,477 $2,827 $3,152 $20.505 $16,490 $12,010 $6,011 $5,428 $535 $732 $0 $0 $150 $1,077 $15,9 $8,397 $33,876 $14,012 $30,115 89t'/Zt t (Short Term / Long Term) $12.038 Taxes $5.560 $2.224 $4,219 $7,979 $11,053 Profit Sharing $258 $103 $157 $402 $198 $337 $3,391 Net Profit $6.553 $7,678 $19.715 $9,696 $16.531 G109177 Page 3 Round 3 THE GLOBE Dec. 31 2022 Financial Summary Financial statements provide insight into the company's activities for the year from the financial perspective, presented according to accounting rules. Cash Flow Statement Survey Andrews Baldwin Chester Digby Erie Ferris Cash Flows From Operating Activities Net Income (Loss) $9.983 $6,810 $1.908 $11,541 s8.705 $7.847 Non Cash Items Depreciation $3,477 $4,467 $0 $2.885 $3.152 $5.352 $5,333 S0 Extraordinary Gains/Losses/Writeoff Changes in current assets and liabilities Accounts Payable Inventory $0 $0 $0 SC (S321 $3,561 ($16,365) ($5,725) ($2,521) $173 ($5,827) ($752) $5,184 (S844) $2,072 $1,305 ($2,715) $11.374 ($32,004) ($45,063) $0 $672 ($505) $26,140 $2,188 ($34,329) Accounts Receivable $10,714 Net Cash From Operations Cash Flows From Investing Activities Plant Improvements (Net) Cash Flows From Financing Activities ($22,215) $0 $0 ($11,000) ($880) ($11,808) ($19,000) $0 $0 $0 so ($864) Sales of Common Stock $11.300 $14,321 tn en $1,000 $35,394 Purchase of Common Stock so $0 $0 $0 $0 Cash from Long Term Debt Issued Early Retirement of Long Term Debt Retirement of Current Debt Cash From Current Debt Borrowing Cash From Emergency Loan $10,000 $9,814 $0 $0 $13,000 SC $0 $0 S0 $0 $0 $0 ($12,486) ($2,300) $0 ($5,200) $5.000 ($2,200) $0 ($49,356) $15,000 $6,536 ($13,820) ($512) ($2,200) $0 $0 $0 $8,620 $6,420 ($279) (S16,073) $0 $8.814 ($676) $18.851 $21.835 ($200) $32,330 ($553) ($21,551) Net Cash From Financing Activities Effect of Exchange Rate Net Change In Cash Position ($410) $7,904 ($57) $4,047 Baldwin Balance Sheet Survey Chester Digby Erie Ferris Andrews Cash $18.851 $37,927 $21.624 $32.286 $0 $11,527 $16,365 $65,818 $5,302 $15,673 $42,600 $43,280 ($20,165) $1,035 $11,264 $43,465 $54,729 $8,915 Accounts Receivable Inventory Total Current Assets $39,359 $46,328 $50,478 $58.210 $47,363 $47,280 ($21,136) $91,680 $80,000 ($24,333) $55,667 $147,346 $11,855 $0 Plant and Equipment $52,160 $67,000 $80,281 ($25,125) Accumulated Depreciation ($21,355) $30,805 $89,015 $4,928 $0 ($22,867) $44,133 $109,952 $6,066 $0 Total Fixed Assets $23.115 $26.144 $55,156 $109,885 $12,467 $21,536 $65,714 $3,557 $5,000 $73.507 Total Assets $8,686 $8,620 Account Payable Current Debt $25 $30 $16 . T mDebt e20 928 $36,146 $28.306 $65.503 $19.557 $27.855 Common Stock $23,808 $37,633 $5,808 $5,808 $6,808 $68,863 Retained Eamings Total Equity Total Liabilities Owners Equity $35,280 $59,088 $36,172 $40,349 $39,393 $45,201 $37,574 $50,628 $119,491 $73,805 $46,157 $44,382 $89,015 $109.952 $65.714 $73.507 $109.885 $147,346 Income Statement Survey Andrews Baldwin Chester Digby $62,991 Erie Ferris $114,511 $140,244 $137,043 $108,472 Sales $64,506 Costs(Labor,Material,Carry,Shipping) $2.885 $3,152 Depreciation $3.477 $4,467 $5,352 5,333 $16,080 $16,805 $24,808 SG&A (R&D/Promo/Sales/Admin) Fees/Writeoffs) $14,132 $6,343 $4,759 EBIT $21,885 $22.180 $15.943 $14.073 $21,755 $7.385 Interest (Short Term / Long Term) $2,747 $3,074 $3,498 $6,906 $1,934 $7,026 $1.994 Taxes $8,615 $5,126 $4.377 $6.722 $3,442 $236 $139 Profit Sharing Net Profit $213 $178 $161 $40 $9.983 $11.541 s8.705 $6.810 $7.847 $1.908 Ratio How to calculate it Round 1 Round 2 Round 3 What it means Round 0 Interpretation Liquidity- A firms ability to meet short term financial obligations The extent to which a firm can meet its short term obligations (ess than 1 indicates an inability to meet short term obligations) Current assetseurrent liabilities Current Ratio (Current assets-inventorycurren linbilities The extent to which a firm can meet its short term cbligations without relying upon t Quick Ratio sale of inventories Leveruge The extent to which a firm has been financed by debt The percentage of total funds that are provided by creditors. A ratio Debt to total assets Tetal debttotal assets debt. of total funds provided by cred ewners A ratio less than 1 indicates that the company has less debt Teal debutotal stockholders equity Debt to equity than equity fumding their assets Greater than 1 indicatesmore debt than equity How much of the company's assets higher e funded with debt? The Leverage Total assets total equity assetequity ratio, the more debe is in the mix Activity How effectively a f is using its resour ces ting a sufficient volume of basiness for the size of its asset invesment. It answers the question, for every dollar Salestotal assets Total assets turnever of assets, how many sakes dollars to we generate? Profitability- Managements effectiveness at generating financial returns r xpenses and yield a tal margin available to cover operating refit Contribution margin Sales minus variable costs'ssles This shows how much return management has earned on all assets Net profittotal asscts. Return on total assets (ROA) availa ble to . The ligher the ROA the beter because the comeany gmore money on less investment Net profitnumber of shares of common Farnings available to the owners of eommon stock Earning per share (EPS) stock outstanding PVE ratio is used to determine the relative value of a company's shares in an "apple-to-apple" comparison. Itcan also be used to compare a company against its historical trend, It leoks at the |attractiveness of firm on equity markets Market price per sharelcarnings per share Price-Earnings (PE) ratio Growth- Examines revenue or profitability over time ereenta ge prowth in HPS from one time Firms erowth neriod to ancther (round lround 0, e.. EPS- ereater than 1 indicates prowth, less than Earnings per share NA Lindicates reduction Pereentage growth in total sales from on time period to another (round 1reund 0 Firms growth rate in sakes- greater than l indicates growth, less than. Lindic ates reduction Sale NA


