Answered step by step
Verified Expert Solution
Question
1 Approved Answer
Use the information found on the Income Statement and Balance Sheet to calculate the following ratios (change years if necessary to reflect the 3 most
Use the information found on the Income Statement and Balance Sheet to calculate the following ratios (change years if necessary to reflect the 3 most recent).
| Years | 2019 | 2018 | 2017 |
| Profit margin |
|
|
|
| Return on Assets |
|
|
|
| Return on Equity |
|
|
|
| Current Ratio |
|
|
|
| Debt Ratio |
|
|
|
| Your choice (name the ratio i.e Inv. Turnover) |
|
|
|
Review the sources and uses of cash on the most recent Statement of Cash Flows and identify the following (individual item - not headings):
|
| Description and amount |
| Major Source of Cash |
|
| Major Use of Cash |
|


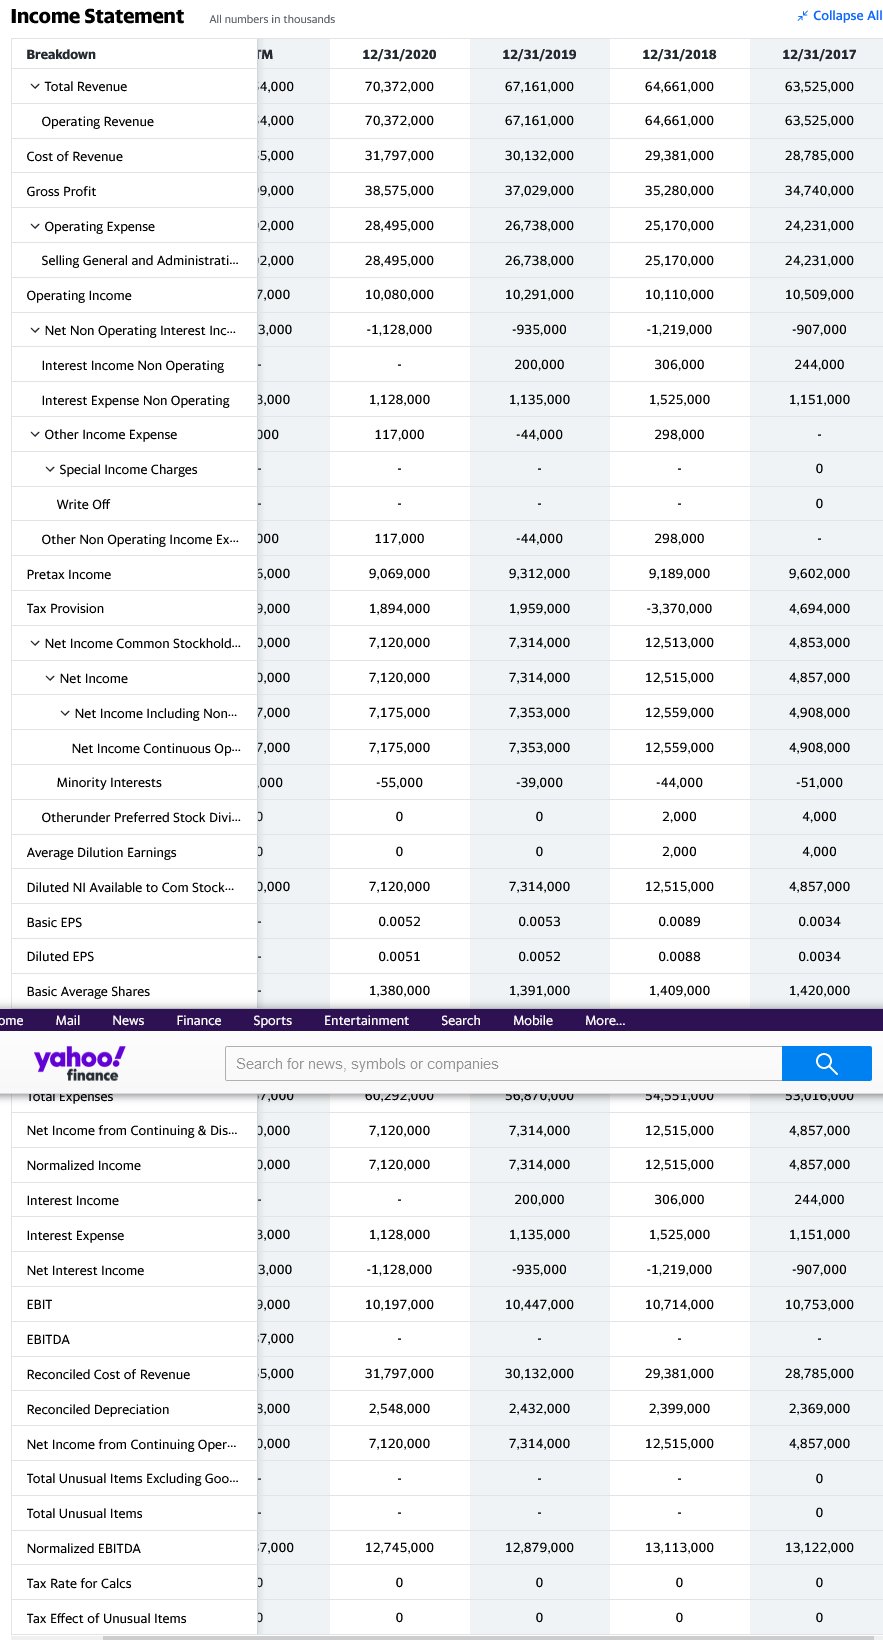
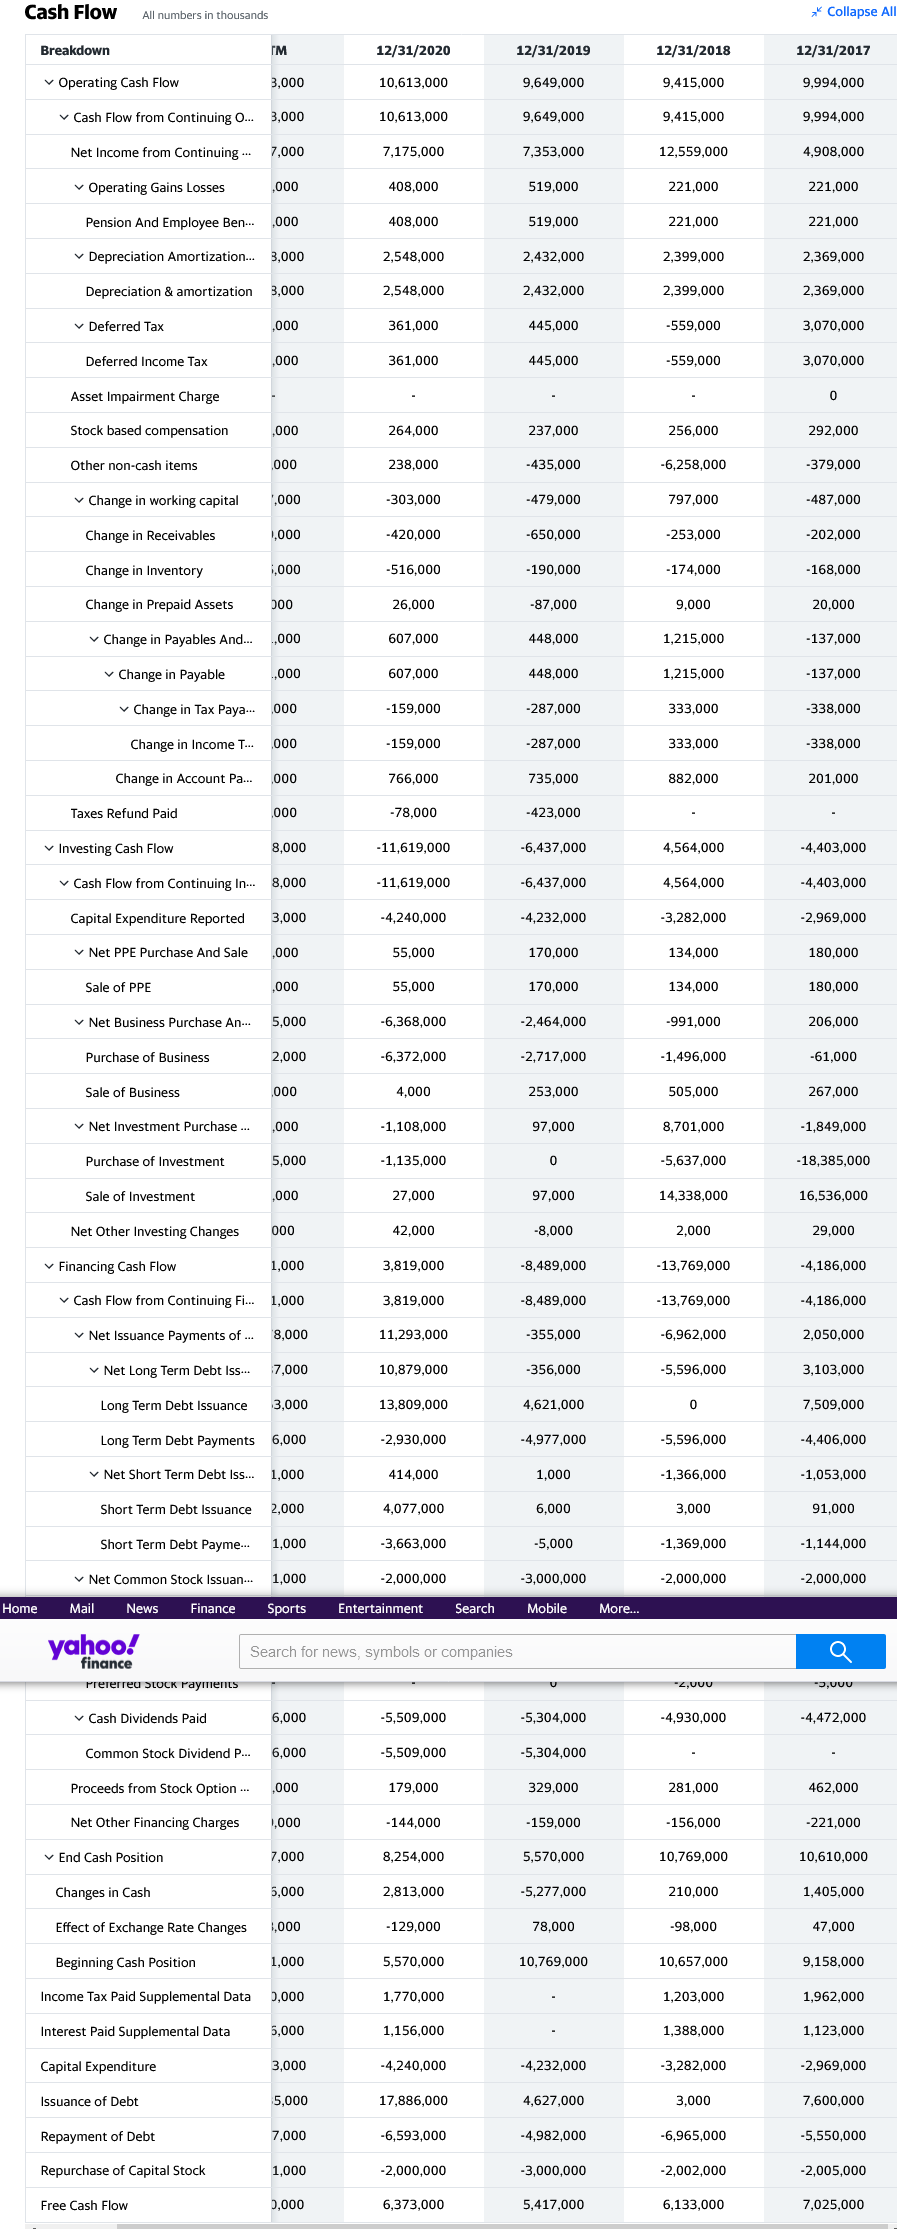
Income Statement All numbers in thousands * Collapse All Breakdown 12/31/2020 12/31/2019 12/31/2018 12/31/2017 Total Revenue 4,000 70,372,000 67,161,000 64,661,000 63,525,000 Operating Revenue 4,000 70,372,000 67,161,000 64,661,000 63,525,000 Cost of Revenue 5,000 31,797,000 30,132,000 29,381,000 28,785,000 Gross Profit 9,000 38,575,000 37,029,000 35,280,000 34,740,000 Operating Expense 2,000 28,495,000 26,738,000 25,170,000 24,231,000 Selling General and Administrati... 2,000 28,495,000 26,738,000 25,170,000 24,231,000 Operating Income 7,000 10,080,000 10,291,000 10,110,000 10,509,000 Net Non Operating Interest Inc... 3,000 -1,128,000 -935,000 -1,219,000 -907,000 Interest Income Non Operating 200,000 306,000 244,000 Interest Expense Non Operating 3,000 1,128,000 1,135,000 1,525,000 1,151,000 Other Income Expense 000 117,000 -44,000 298,000 Special Income Charges 0 Write Off 0 Other Non Operating Income Ex... 000 117,000 -44.000 298.000 Pretax Income 5,000 9,069,000 9,312,000 9,189,000 9,602,000 Tax Provision 9,000 1,894,000 1,959,000 -3,370,000 4,694,000 Net Income Common Stockhold... 0,000 7,120,000 7,314,000 12,513,000 4,853.000 Net Income 0,000 7,120,000 7,314,000 12,515,000 4,857,000 Net Income Including Non... 7,000 7,175,000 7,353,000 12,559,000 4,908,000 Net Income Continuous Op... 7,000 7,175,000 7,353,000 12,559,000 4,908,000 Minority Interests 000 -55,000 -39,000 -44,000 -51,000 Otherunder Preferred Stock Divi... ) 0 0 2,000 4,000 Average Dilution Earnings D 0 0 2,000 4,000 Diluted NI Available to Com Stock... 0,000 7,120,000 7,314,000 12,515,000 4,857,000 Basic EPS 0.0052 0.0053 0.0089 0.0034 Diluted EPS 0.0051 0.0052 0.0088 0.0034 Basic Average Shares 1,380,000 1,391,000 1,409,000 1,420,000 ome Mail News Finance Sports Entertainment Search Mobile More... yahoo! Search for news, symbols or companies finance Total Expenses W.UUU OU,292,UUU 50,07 UUUU I , UUU,4 55,10,UUU Net Income from Continuing & Dis... 0,000 7,120,000 7,314,000 12,515,000 4,857,000 Normalized Income 0,000 7,120,000 7,314,000 12,515,000 4,857,000 Interest Income 200,000 306.000 244,000 Interest Expense 3,000 1,128,000 1,135,000 1,525,000 1,151,000 Net Interest Income 3,000 -1.128.000 -935,000 - 1.219,000 -907,000 EBIT 9,000 10,197,000 10,447,000 10,714,000 10,753,000 EBITDA 7,000 Reconciled Cost of Revenue 5,000 31,797,000 30,132,000 29,381,000 28,785,000 Reconciled Depreciation 3,000 2,548,000 2,432,000 2,399,000 2,369,000 Net Income from Continuing Oper... 0.000 7,120,000 7,314,000 12,515,000 4,857,000 Total Unusual Items Excluding Goo... 0 Total Unusual Items 0 Normalized EBITDA 7,000 12,745,000 12,879,000 13,113,000 13,122,000 Tax Rate for Calcs D 0 0 0 0 Tax Effect of Unusual Items D 0 0 0 0 Balance Sheet All numbers in thousands * Colla: Breakdown 12/31/2020 12/31/2019 12/31/2018 12/31/2017 Total Assets 92,918,000 78,547,000 77,648,000 79,804,000 Current Assets 23,001,000 17,645,000 21.893,000 31,027,000 Cash, Cash Equivalents & S... 9,551,000 5,738,000 8,993,000 19,510,000 Cash And Cash Equivalents 8,185,000 5,509,000 8,721,000 10,610,000 Other Short Term Investme... 1,366,000 229.000 272,000 8,900,000 Receivables 8,404,000 7,822,000 7,142,000 7,024,000 Accounts receivable 6,892,000 6,447,000 6,079,000 5,956,000 Other Receivables 1,713.000 1,480,000 1,164,000 1,197,000 Receivables Adjustments A... -201,000 -105,000 -101,000 -129.000 Inventory 4,172,000 3,338,000 3,128,000 2,947,000 Raw Materials 1,720,000 1,395,000 1,312,000 1,344,000 Work in Process 205,000 200,000 178,000 167,000 Finished Goods 2,247,000 1,743,000 1,638,000 1,436,000 Prepaid Assets 874,000 747,000 633,000 1,546,000 Restricted Cash 0 1,997,000 Total non-current assets 69,917,000 60,902,000 55,755,000 48,777,000 Net PPE 23,039,000 20,853,000 17,589,000 17,240,000 Gross PPE 48,010,000 44,551,000 40,164,000 39,106,000 Properties 0 0 0 0 Land And Improvements 1,171,000 1,130,000 1,078,000 1,148,000 Buildings And Improvem... 10,214,000 9,314,000 8,941,000 8,796,000 Machinery Furniture Equ... 31,276,000 29,390,000 27,715,000 27,018,000 Other Properties 1,670,000 1,548,000 Construction in Progress 3,679,000 3,169,000 2,430,000 2,144,000 Accumulated Depreciation -24,971,000 -23,698,000 -22,575,000 -21,866,000 Goodwill And Other Intang... 38,072,000 31,544,000 30,633,000 28,582,000 Goodwill 18,757,000 15,501,000 14,808,000 14,744,000 Other Intangible Assets 19.315,000 16,043,000 15,825,000 13.838,000 Investments And Advances 2,792,000 2,683,000 2,409,000 2,042,000 Long Term Equity Invest... 2,792,000 2,683,000 2,409,000 2,042,000 Investments in Associat... 2,792,000 2,683,000 2,409,000 2,042,000 Non Current Accounts Receiv... 109,000 85,000 86,000 59,000 Non Current Deferred Ass... 4,502,000 4,506,000 4,476,000 134,000 Non Current Deferred Taxe... 4,372,000 4,359,000 4,364,000 Defined Pension Benefit 910,000 846,000 269,000 374,000 Other Non Current Assets 493,000 385,000 293,000 346,000 Total Liabilities Net Minority Int... 79,366,000 63,679,000 63,046,000 68,823,000 Current Liabilities 23,372,000 20,461,000 22,138,000 20,502,000 Payables And Accrued Exp... 13,218,000 12,187,000 13,080,000 10,278,000 Payables 10,283,000 9,422,000 10,539,000 7,888,000 Accounts Payable 8,853,000 8,013,000 7,213,000 6,727,000 Dividends Payable 1,430,000 1,351,000 1,329,000 1,161,000 Other Payable 58,000 1,997,000 Current Accrued Expenses 2,935,000 2,765,000 2,541,000 2,390,000 Pension & Other Post Retirem... 2,059,000 1,835,000 1,755,000 1,785,000 Current Debt And Capital ... 4,240,000 3,362,000 4,026,000 5,485,000 Current Debt 3,780,000 2,920,000 4,026,000 5,485,000 Commercial Paper 396,000 0 1,385,000 Other Current Borrowings 3,384,000 2,920,000 4,026,000 4,100,000 Current Capital Lease Oblig... 460,000 442,000 Other Current Liabilities 3,855,000 3,077,000 3,277,000 2,954,000 Total Non Current Liabilities ... 55,994,000 43,218,000 40,908,000 48,321,000 Long Term Debt And Capit... 40,370,000 29,148,000 28,295,000 33,796,000 Long Term Debt 40,370,000 29,148,000 28,295,000 33,796,000 Non Current Deferred Liab... 4,284,000 4,091,000 3,499,000 3,242,000 Non Current Deferred Taxe... 4,284,000 4,091,000 3,499,000 3,242,000 Other Non Current Liabilities 11,340,000 9,979,000 9,114,000 11,283,000 Total Equity Gross Minority Inte... 13,552,000 14,868,000 14,602,000 10,981,000 Stockholders' Equity 13,454,000 14,786,000 14,518,000 10,889,000 Capital Stock 23,000 23,000 23,000 65,000 Preferred Stock 0 41,000 Common Stock 23,000 23,000 23.000 24,000 2.799.000 Additional Paid in Garital Mail News Finance Home 2910000 Sports Entertainment 2 996.000 Search Mobile 2952000 More... yahoo! Search for news, symbols or companies a finance Gains Losses Not Affecting Re... -15,476,000 -14,300,000 -15,119,000 -13,057,000 Minority Interest 98,000 82,000 84.000 92,000 Total Capitalization 53,824,000 43,934,000 42.813.000 44,685,000 Preferred Stock Equity 41,000 Common Stock Equity 13,454,000 14,786,000 14,518,000 10,848,000 Capital Lease Obligations 460,000 442,000 Net Tangible Assets -24,618,000 -16,758,000 - 16,115,000 -17,693,000 Working Capital -371,000 -2,816,000 -245,000 10,525,000 Invested Capital 57,604,000 46,854,000 46,839,000 50,129,000 Tangible Book Value -24,618,000 -16,758,000 -16,115,000 -17,734,000 Total Debt 44,610,000 32,510,000 32,321,000 39,281,000 Net Debt 35,965,000 26,559,000 23,600,000 28,671,000 Share issued 1,867,000 1,867,000 1,867,000 1,866,000 Ordinary Shares Number 1,380,000 1,391,000 1,409,000 1,420,000 Preferred Shares Number 800 Treasury Shares Number 487,000 476,000 458.000 446,000 Cash Flow All numbers in thousands Collapse All Breakdown IM 12/31/2020 12/31/2019 12/31/2018 12/31/2017 Operating Cash Flow 3,000 10,613,000 9,649,000 9,415,000 9,994.000 Cash Flow from Continuing O... 3,000 10,613,000 9,649,000 9,415,000 9,994,000 Net Income from Continuing ... 7,000 7,175,000 7,353,000 12,559,000 4,908,000 Operating Gains Losses .000 408,000 519,000 221,000 221,000 Pension And Employee Ben... .000 408,000 519,000 221,000 221,000 Depreciation Amortization... 3,000 2,548,000 2,432,000 2,399,000 2,369,000 Depreciation & amortization 3,000 2,548,000 2,432,000 2,399,000 2,369,000 Deferred Tax ,000 361,000 445,000 -559,000 3,070,000 Deferred Income Tax ,000 361,000 445,000 -559,000 3,070,000 Asset Impairment Charge 0 Stock based compensation ,000 264,000 237,000 256,000 292,000 Other non-cash items 000 238,000 -435,000 -6,258,000 -379,000 Change in working capital 1,000 -303,000 -479,000 797,000 -487,000 Change in Receivables 1,000 -420,000 -650.000 -253,000 -202.000 Change in Inventory 1,000 -516,000 -190,000 -174,000 - 168,000 Change in Prepaid Assets 000 26,000 -87,000 9.000 20,000 Change in Payables And... ..000 607,000 448,000 1,215,000 -137,000 Change in Payable .,000 607,000 448,000 1,215,000 - 137,000 Change in Tax Paya... 000 -159,000 -287,000 333,000 -338,000 Change in Income T... 000 -159.000 -287.000 333,000 -338.000 Change in Account Pa... 000 766,000 735,000 882,000 201,000 Taxes Refund Paid ,000 -78,000 -423,000 Investing Cash Flow 8,000 -11,619,000 -6,437,000 4,564,000 -4,403,000 Cash Flow from Continuing In... 8,000 -11,619,000 -6,437,000 4,564,000 -4,403,000 Capital Expenditure Reported 3,000 -4,240,000 -4,232,000 -3,282,000 -2,969,000 Net PPE Purchase And Sale .000 55,000 170,000 134,000 180,000 Sale of PPE ,000 55.000 170,000 134.000 180,000 Net Business Purchase An... 5,000 -6,368,000 -2,464,000 -991,000 206,000 Purchase of Business 2,000 -6,372,000 -2,717,000 -1,496,000 -61,000 Sale of Business ,000 4,000 253,000 505.000 267,000 Net Investment Purchase ... .000 - 1,108,000 97,000 8,701,000 -1,849,000 Purchase of Investment 5,000 -1,135,000 0 -5,637,000 -18,385,000 Sale of Investment ,000 27,000 97,000 14,338,000 16,536,000 Net Other Investing Changes 000 42,000 -8,000 2,000 29,000 Financing Cash Flow 1,000 3,819,000 -8,489,000 - 13,769,000 -4,186,000 Cash Flow from Continuing Fi... 1,000 3,819,000 -8,489,000 - 13,769,000 -4,186,000 Net Issuance Payments of ... 8,000 11,293,000 -355,000 -6,962,000 2,050,000 Net Long Term Debt Iss... 7,000 10,879,000 -356,000 -5,596,000 3,103,000 Long Term Debt Issuance 3,000 13,809,000 4,621,000 0 7,509,000 Long Term Debt Payments 6,000 -2,930,000 -4,977,000 -5,596,000 -4,406,000 Net Short Term Debt Iss... 1,000 414.000 1.000 -1,366,000 -1,053,000 Short Term Debt Issuance 2,000 4,077,000 6.000 3,000 91,000 Short Term Debt Payme... 1,000 -3,663,000 -5,000 -1.369.000 -1,144,000 Net Common Stock Issuan... 1,000 -2,000,000 -3,000,000 -2,000,000 -2,000,000 Home Mail News Finance Sports Entertainment Search Mobile More... yahoo! Search for news, symbols or companies finance Prererreu SLUCK Payments 2.UUU 3.UUU Cash Dividends Paid 6,000 -5,509,000 -5,304,000 -4,930,000 -4,472,000 Common Stock Dividend P... 6,000 -5,509,000 -5,304,000 Proceeds from Stock Option ... ,000 179.000 329.000 281,000 462,000 Net Other Financing Charges 1,000 -144,000 -159,000 -156,000 -221,000 End Cash Position 7,000 8,254,000 5,570,000 10,769,000 10,610,000 Changes in Cash 5,000 2,813,000 -5,277,000 210,000 1,405,000 Effect of Exchange Rate Changes 1,000 -129,000 78,000 -98,000 47,000 Beginning Cash Position 1,000 5,570,000 10,769,000 10,657,000 9,158,000 Income Tax Paid Supplemental Data 0,000 1,770,000 1,203,000 1,962,000 Interest Paid Supplemental Data 5,000 1,156,000 1,388,000 1,123,000 Capital Expenditure 3,000 -4,240,000 -4,232,000 -3,282,000 -2,969,000 Issuance of Debt 5,000 17,886,000 4,627,000 3,000 7,600,000 Repayment of Debt 7,000 -6,593,000 -4,982,000 -6,965,000 -5,550,000 Repurchase of Capital Stock 1,000 -2,000,000 -3,000,000 -2,002,000 -2,005,000 Free Cash Flow 0,000 6,373,000 5,417,000 6,133,000 7,025,000
Step by Step Solution
There are 3 Steps involved in it
Step: 1

Get Instant Access to Expert-Tailored Solutions
See step-by-step solutions with expert insights and AI powered tools for academic success
Step: 2

Step: 3

Ace Your Homework with AI
Get the answers you need in no time with our AI-driven, step-by-step assistance
Get Started


