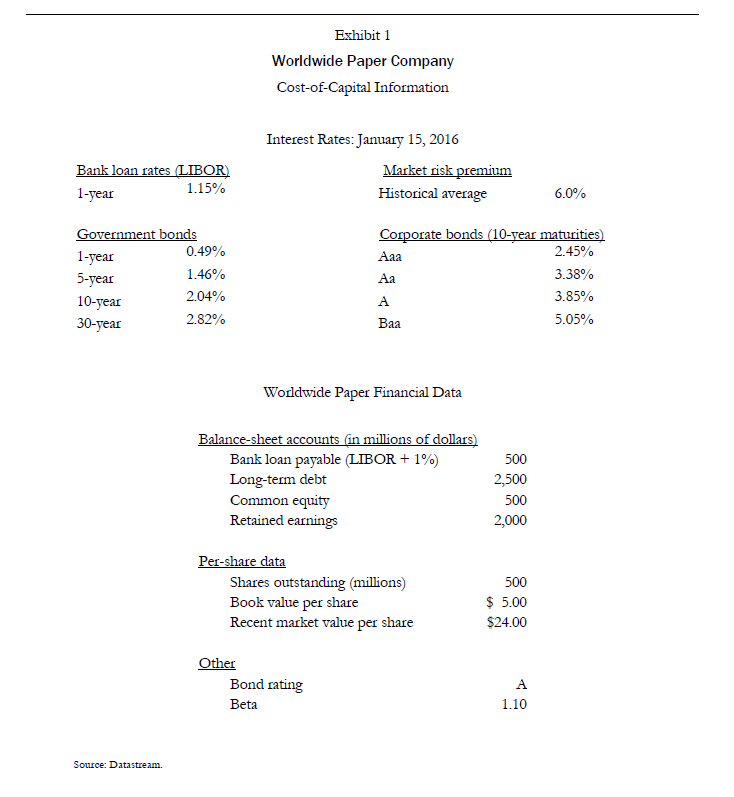
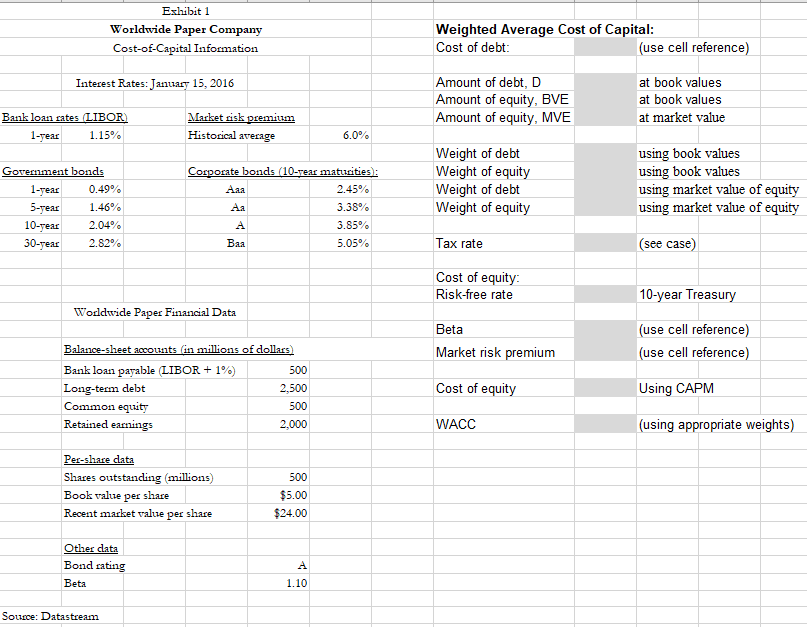
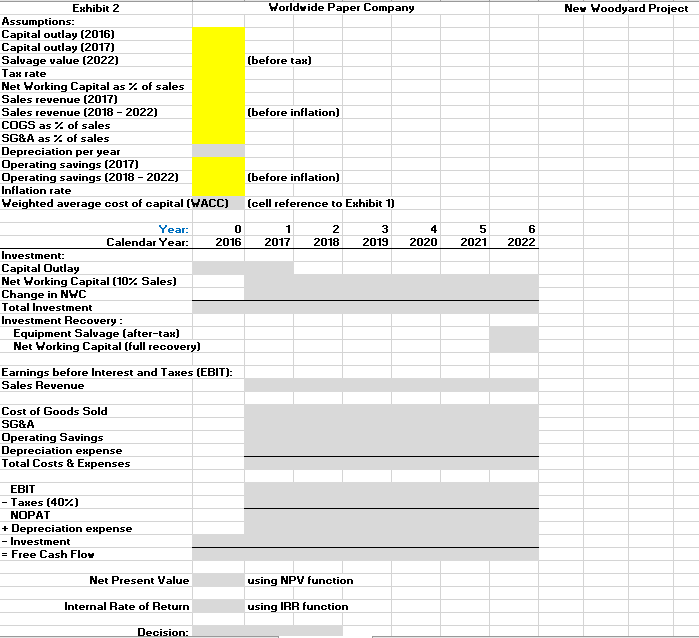
Use the information from Exhibit 1 to answer the excel spreadsheet questions in the grey and yellow marked areas.


Exhibit 1 Worldwide Paper Company Cost-of-Capital Information Bank loan rates (LIBOR) 1-year 1.15% Interest Rates: January 15, 2016 Market risk premium Historical average 6.0% Government bonds 1-year 0.49% 5-year 1.46% 10-year 2.04% 30-year 2.82% Corporate bonds (10-year maturities) 2.45% 3.38% A 3.85% Baa 5.05% Worldwide Paper Financial Data Balance sheet accounts (in millions of dollars) Bank loan payable (LIBOR + 1%) Long-term debt Common equity Retained earnings 500 2,500 500 2,000 Per-share data Shares outstanding (millions) Book value per share Recent market value per share 500 $ 5.00 $24.00 Other Bond rating Beta 1.10 Source: Datastream. Exhibit 1 Worldwide Paper Company Cost-of-Capital Information Weighted Average Cost of Capital: Cost of debt: (use cell reference) Interest Rates: January 15, 2016 Amount of debt, D Amount of equity, BVE Amount of equity, MVE at book values at book values at market value Bank loan cates (LIBOR) 1-year 1.15% Market cisk premium Historical average 6.0% Government bonds 1-year 0.49% 5-year 1.46% 10-year 2.04% 30-year 2.82% Corporate bonds (10-year maturities): Aaa 2.45% Aa 3.38% 3.85% Baa 5.05% Weight of debt Weight of equity Weight of debt Weight of equity using book values using book values using market value of equity using market value of equity Tax rate (see case) Cost of equity: Risk-free rate 10-year Treasury Worldwide Paper Financial Data Beta Market risk premium (use cell reference) (use cell reference) Balance sheet accounts (in millions of dollars) Bank loan payable (LIBOR + 1%) 500 Long-term debt 2,500 Common equity 500 Retained earnings 2,000 Cost of equity Using CAPM WACC (using appropriate weights) 500 Per-share data Shares outstanding millions) Book value per share Recent market value per share $5.00 $24.00 Other data Bond cating Beta A 1.10 Source: Datastream Worldwide Paper Company Ney Woodyard Project (before tax) Exhibit 2 Assumptions: Capital outlay (2016) Capital outlay (2017) Salvage value (2022) Tax rate Net Working Capital as % of sales Sales revenue (2017) Sales revenue (2018 - 2022) COGS as of sales SG&A as % of sales Depreciation per year Operating savings (2017) Operating savings (2018-2022) Inflation rate Weighted average cost of capital (WACC) (before inflation) (before inflation) (cell reference to Exhibit 1) 1 2017 2 2018 3 2019 4 2020 5 2021 6 2022 Year: 0 Calendar Year: 2016 Investment: Capital Outlay Net Working Capital (10% Sales) Change in NYC Total Investment Investment Recovery: Equipment Salvage (after-tax) Net Working Capital (full recovery) Earnings before Interest and Taxes (EBIT): Sales Revenue Cost of Goods Sold SG&A Operating Savings Depreciation expense Total Costs & Expenses EBIT - Taxes (407) NOPAT + Depreciation expense - Investment = Free Cash Floy Net Present Value using NPV function Internal Rate of Return using IRR function Decision: Exhibit 1 Worldwide Paper Company Cost-of-Capital Information Bank loan rates (LIBOR) 1-year 1.15% Interest Rates: January 15, 2016 Market risk premium Historical average 6.0% Government bonds 1-year 0.49% 5-year 1.46% 10-year 2.04% 30-year 2.82% Corporate bonds (10-year maturities) 2.45% 3.38% A 3.85% Baa 5.05% Worldwide Paper Financial Data Balance sheet accounts (in millions of dollars) Bank loan payable (LIBOR + 1%) Long-term debt Common equity Retained earnings 500 2,500 500 2,000 Per-share data Shares outstanding (millions) Book value per share Recent market value per share 500 $ 5.00 $24.00 Other Bond rating Beta 1.10 Source: Datastream. Exhibit 1 Worldwide Paper Company Cost-of-Capital Information Weighted Average Cost of Capital: Cost of debt: (use cell reference) Interest Rates: January 15, 2016 Amount of debt, D Amount of equity, BVE Amount of equity, MVE at book values at book values at market value Bank loan cates (LIBOR) 1-year 1.15% Market cisk premium Historical average 6.0% Government bonds 1-year 0.49% 5-year 1.46% 10-year 2.04% 30-year 2.82% Corporate bonds (10-year maturities): Aaa 2.45% Aa 3.38% 3.85% Baa 5.05% Weight of debt Weight of equity Weight of debt Weight of equity using book values using book values using market value of equity using market value of equity Tax rate (see case) Cost of equity: Risk-free rate 10-year Treasury Worldwide Paper Financial Data Beta Market risk premium (use cell reference) (use cell reference) Balance sheet accounts (in millions of dollars) Bank loan payable (LIBOR + 1%) 500 Long-term debt 2,500 Common equity 500 Retained earnings 2,000 Cost of equity Using CAPM WACC (using appropriate weights) 500 Per-share data Shares outstanding millions) Book value per share Recent market value per share $5.00 $24.00 Other data Bond cating Beta A 1.10 Source: Datastream Worldwide Paper Company Ney Woodyard Project (before tax) Exhibit 2 Assumptions: Capital outlay (2016) Capital outlay (2017) Salvage value (2022) Tax rate Net Working Capital as % of sales Sales revenue (2017) Sales revenue (2018 - 2022) COGS as of sales SG&A as % of sales Depreciation per year Operating savings (2017) Operating savings (2018-2022) Inflation rate Weighted average cost of capital (WACC) (before inflation) (before inflation) (cell reference to Exhibit 1) 1 2017 2 2018 3 2019 4 2020 5 2021 6 2022 Year: 0 Calendar Year: 2016 Investment: Capital Outlay Net Working Capital (10% Sales) Change in NYC Total Investment Investment Recovery: Equipment Salvage (after-tax) Net Working Capital (full recovery) Earnings before Interest and Taxes (EBIT): Sales Revenue Cost of Goods Sold SG&A Operating Savings Depreciation expense Total Costs & Expenses EBIT - Taxes (407) NOPAT + Depreciation expense - Investment = Free Cash Floy Net Present Value using NPV function Internal Rate of Return using IRR function Decision


