Question
Use the internal growth rate (IGR) as a permanent growth rate in dividends and estimate the stock price using the single-stage dividend growth model. Use
Use the internal growth rate (IGR) as a permanent growth rate in dividends and estimate the stock price using the single-stage dividend growth model. Use the financial data to find the current dividend per share. There are 3 million shares outstanding. What does the dividend growth model predict the stock price to be? How does the required return break down into its income (DY) and price (CGY) components? IGR= 4.022%
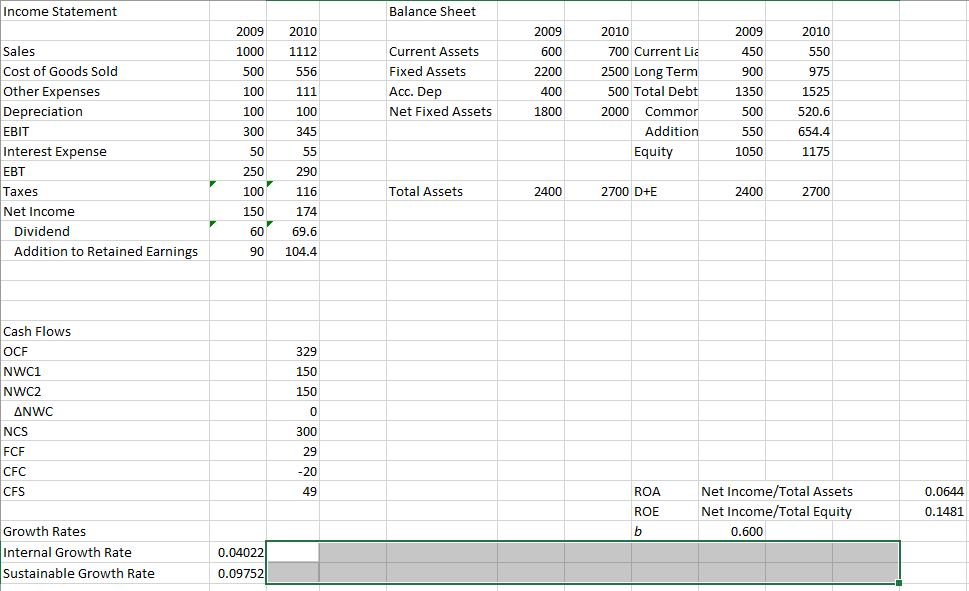
This is all the financial data. How do I calculate current dividend per share from this? Required return on stock is 10% Number of shares outstanding is 3,000,000.
Income Statement Balance Sheet 2009 1000 500 100 100 300 2010 1112 556 111 100 345 Current Assets Fixed Assets Acc. Dep Net Fixed Assets 2009 600 2200 400 1800 Sales Cost of Goods Sold Other Expenses Depreciation EBIT Interest Expense EBT Taxes Net Income Dividend Addition to Retained Earnings 2010 700 Current Lia 2500 Long Term 500 Total Debt 2000 Commor Addition Equity 2009 450 900 1350 500 550 1050 2010 550 975 1525 520.6 654.4 1175 50 Total Assets 2400 2700 D+E 2400 2700 250 100 150 60 90 290 116 174 69.6 104.4 Cash Flows OCF NWC1 NWC2 ANWC NCS FCF CFC CFS ROA ROE Net Income/Total Assets Net Income/Total Equity 0.600 0.0644 0.1481 Growth Rates Internal Growth Rate Sustainable Growth Rate 0.04022 0.09752 Income Statement Balance Sheet 2009 1000 500 100 100 300 2010 1112 556 111 100 345 Current Assets Fixed Assets Acc. Dep Net Fixed Assets 2009 600 2200 400 1800 Sales Cost of Goods Sold Other Expenses Depreciation EBIT Interest Expense EBT Taxes Net Income Dividend Addition to Retained Earnings 2010 700 Current Lia 2500 Long Term 500 Total Debt 2000 Commor Addition Equity 2009 450 900 1350 500 550 1050 2010 550 975 1525 520.6 654.4 1175 50 Total Assets 2400 2700 D+E 2400 2700 250 100 150 60 90 290 116 174 69.6 104.4 Cash Flows OCF NWC1 NWC2 ANWC NCS FCF CFC CFS ROA ROE Net Income/Total Assets Net Income/Total Equity 0.600 0.0644 0.1481 Growth Rates Internal Growth Rate Sustainable Growth Rate 0.04022 0.09752Step by Step Solution
There are 3 Steps involved in it
Step: 1
Get Instant Access to Expert-Tailored Solutions
See step-by-step solutions with expert insights and AI powered tools for academic success
Step: 2
Step: 3
Ace Your Homework with AI
Get the answers you need in no time with our AI-driven, step-by-step assistance
Get Started