

Question
Use the least squares method to fit a simple linear model that relates the annual number of Australian wines sold to the annual growth rate
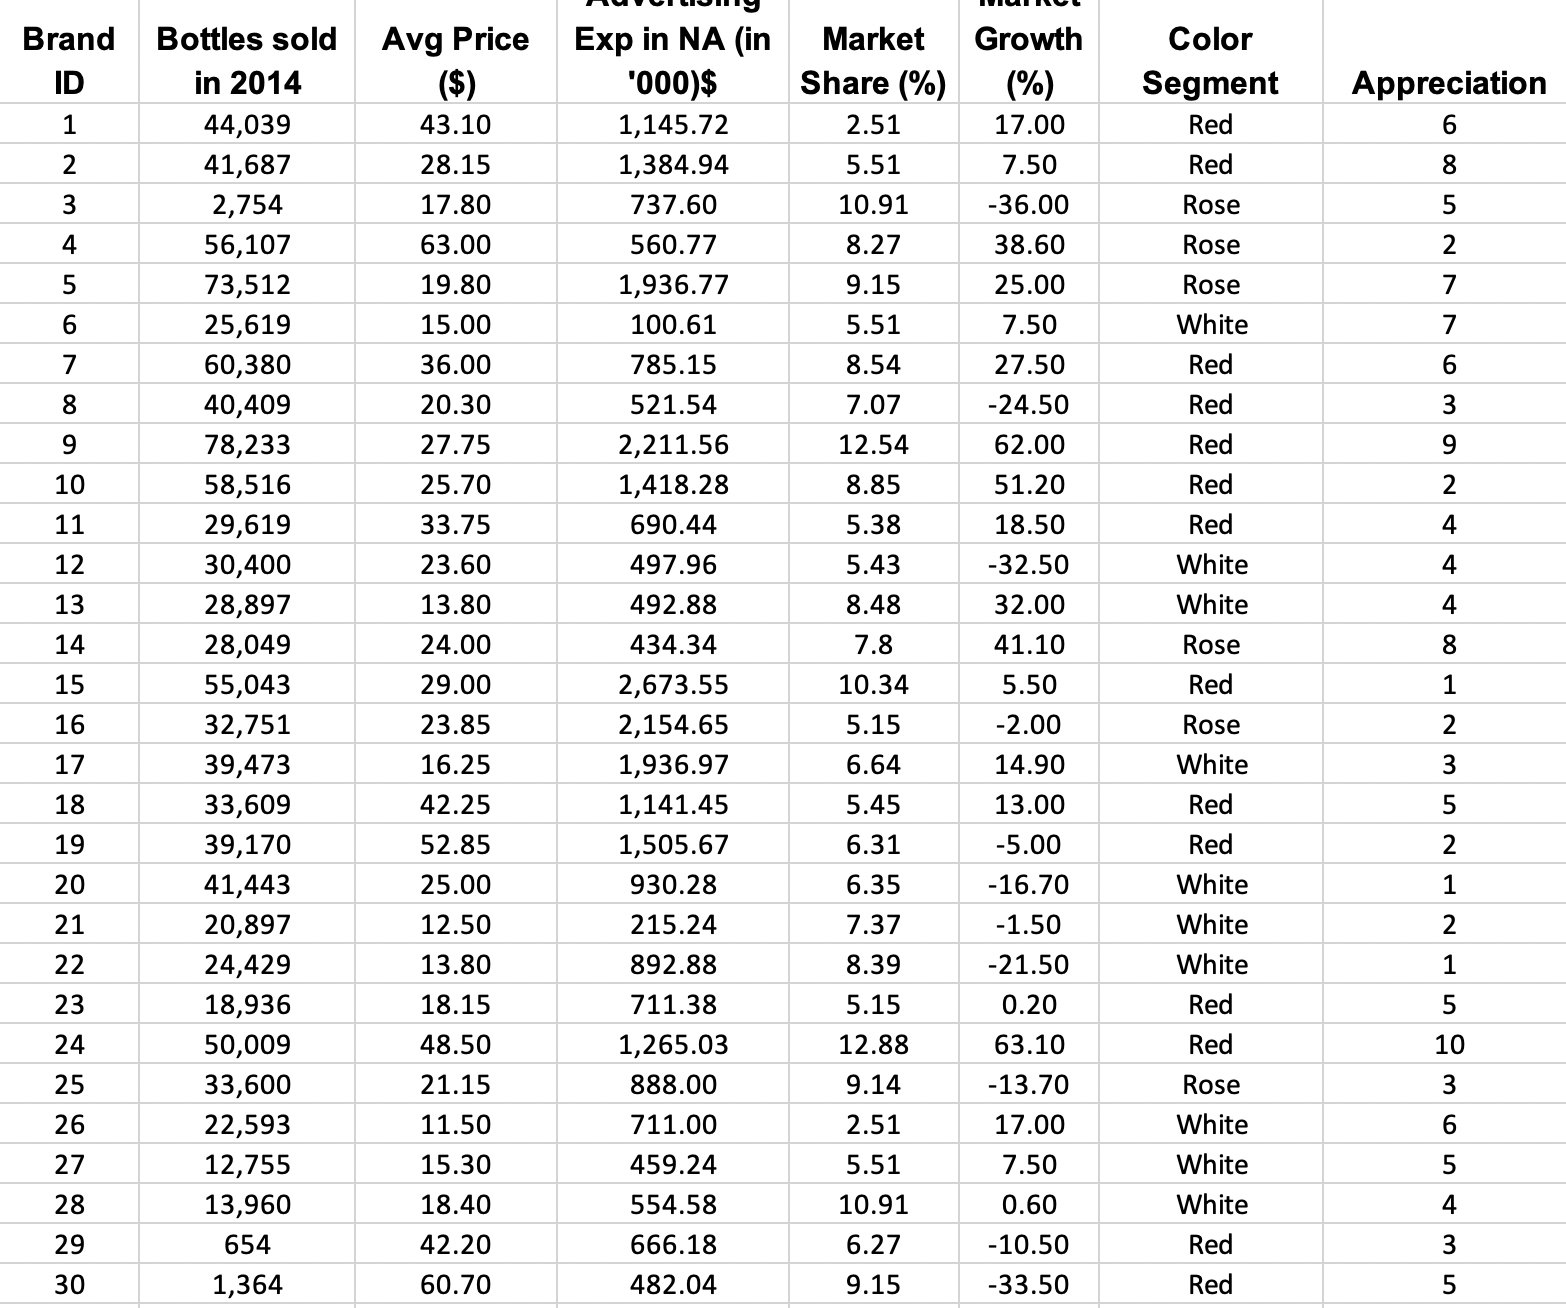
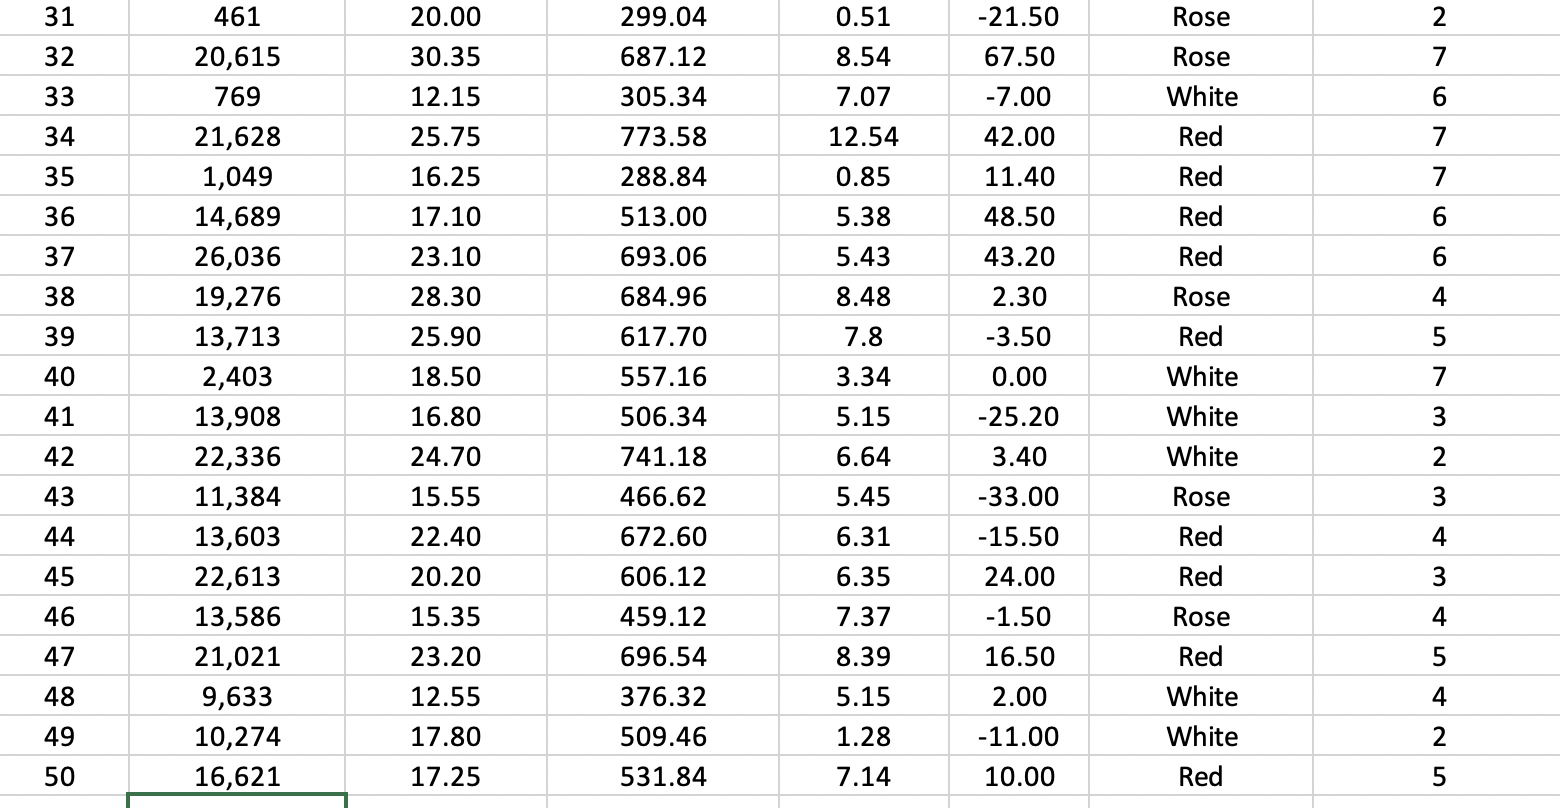
Use the least squares method to fit a simple linear model that relates the annual number of Australian wines sold to the annual growth rate in Canada. In your analysis, state what your model is, and determine whether the independent variable is significant or not at an ?-level of significance = 5%).
- How effective is the independent variable in predicting the movement of the dependent variable?
- Calculate a 90% confidence interval estimate for the true regression slope
Step by Step Solution
There are 3 Steps involved in it
Step: 1

Get Instant Access to Expert-Tailored Solutions
See step-by-step solutions with expert insights and AI powered tools for academic success
Step: 2

Step: 3
Ace Your Homework with AI
Get the answers you need in no time with our AI-driven, step-by-step assistance
Get Started
Statistical Techniques in Business and Economics
Authors: Douglas A. Lind, William G Marchal
17th edition
1259666360, 978-1259666360