

Answered step by step
Verified Expert Solution
Question
1 Approved Answer
Use the normal distribution for following data to generate 10 sets of sales projections (to find min and max, please use last year's growth rate
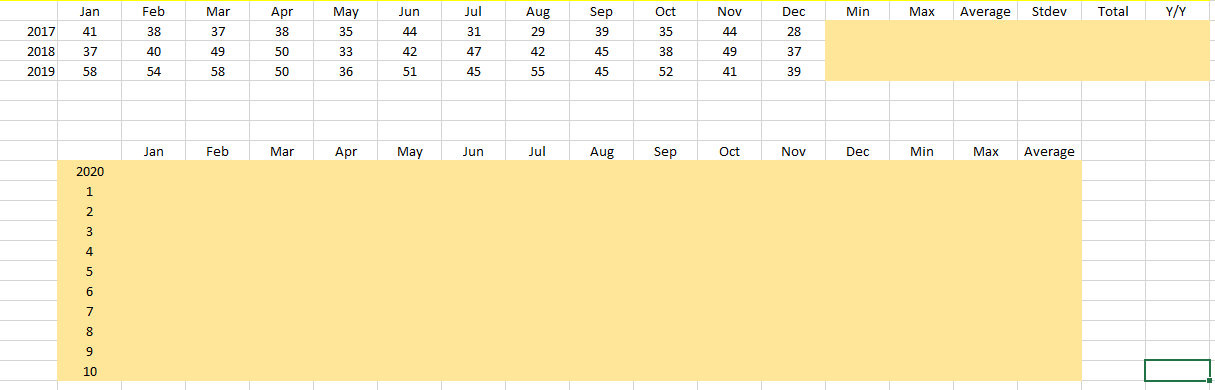 Use the normal distribution for following data to generate 10 sets of sales projections (to find min and max, please use last year's growth rate and use same Stdev of 2019) (Please show formulas)
Step by Step Solution
There are 3 Steps involved in it
Step: 1

Get Instant Access to Expert-Tailored Solutions
See step-by-step solutions with expert insights and AI powered tools for academic success
Step: 2

Step: 3
Ace Your Homework with AI
Get the answers you need in no time with our AI-driven, step-by-step assistance
Get Started
Public Finance In Theory And Practice
Authors: Holley Ulbrich
2nd Edition
041558597X, 978-0415585972