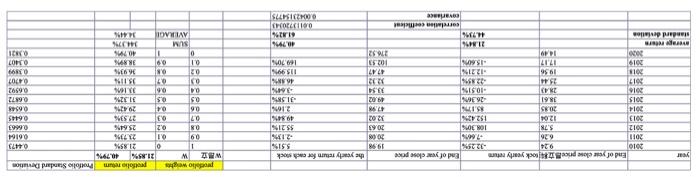
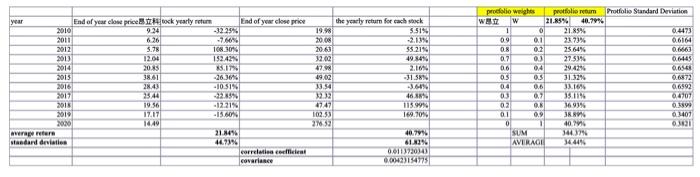
Use the results obtained from part 1 to draw the curve plots of the return (y-axis) and
standard deviation (x-axis) for each portfolio in part 1
Protfolio Standard Drvation year the yearly return for each stock 19.98 3.51% 20:05 20.63 33 21% 12.00 47. 04473 0.6164 0.6663 06145 06548 90 SASIE End of year close price rack yearly reture End of your close price 2010 9.24 -32.29% 2011 6.26 -7.609 2012 5.78 10% 30% 2013 12.04 192.42% 2014 2085 15. 2015 38.61 -26 36 2016 2143 10.51% 20171 23:44 3234 2013 1956 12.31% 2019 17.171 15 30201 1440 verere 21.1496 standard deviation 44.9346 correlation coeficient covariance prololo weights protfore retum WZ W 21.85% 1 0 21.5% 09 2373% 08 9.2 25.64% 07 03 27.53% 29439 03 3.16% 0 07 35.11% 02 16,93% 01 0.9 RA O 1 4074 SUM 340% AVERAGE 14:44% 382388888 31.32% 13.54 22.12 76 46 1159 169.709 0.6872 06592 6,4707 1899 01407 010 102.53 276.52 40.79 61.82% 0.0113220343 0.00423154773 w M the yearly return for each 5.51% 19.98 20.08 20.61 60 80 2015 55.21% 4984% 2.16 -31.589 -3.64% year End of your close price cock yearly return End of year close price 2010 9.24 -32294 2011 6.26 2012 5.78 108.30 2013 12.04 152439 2014 2015 3861 -263646 2016 28.43 10.31% 2017 3544 3299 2015 19.56 - 12.21% 2019 17.17 2020 1649 weer 21.1496 standard deviation 44.939 correlation coefficient covariance $10 profolio weighs protfolio retum Protfolio Standard Deviation 21.85% 40.79% 1 O 21.85% 6.4473 0.1 22.73% 66164 25 64% 0.663 07 00 27.53% 0.6445 06 04 06548 05 31.32% 0.6872 0.4 0.6 33.16% 0.6992 03 0. 35.11% 0.4707 02 08 16934 399 01 09 3 3467 0 ! 4076 0101 3403 AVERAGE 144 47 19.02 33.54 232 4747 102.33 21659 115.99% 169.70% 40.79 61.8290 0.0113220343 0.0021947751 Protfolio Standard Drvation year the yearly return for each stock 19.98 3.51% 20:05 20.63 33 21% 12.00 47. 04473 0.6164 0.6663 06145 06548 90 SASIE End of year close price rack yearly reture End of your close price 2010 9.24 -32.29% 2011 6.26 -7.609 2012 5.78 10% 30% 2013 12.04 192.42% 2014 2085 15. 2015 38.61 -26 36 2016 2143 10.51% 20171 23:44 3234 2013 1956 12.31% 2019 17.171 15 30201 1440 verere 21.1496 standard deviation 44.9346 correlation coeficient covariance prololo weights protfore retum WZ W 21.85% 1 0 21.5% 09 2373% 08 9.2 25.64% 07 03 27.53% 29439 03 3.16% 0 07 35.11% 02 16,93% 01 0.9 RA O 1 4074 SUM 340% AVERAGE 14:44% 382388888 31.32% 13.54 22.12 76 46 1159 169.709 0.6872 06592 6,4707 1899 01407 010 102.53 276.52 40.79 61.82% 0.0113220343 0.00423154773 w M the yearly return for each 5.51% 19.98 20.08 20.61 60 80 2015 55.21% 4984% 2.16 -31.589 -3.64% year End of your close price cock yearly return End of year close price 2010 9.24 -32294 2011 6.26 2012 5.78 108.30 2013 12.04 152439 2014 2015 3861 -263646 2016 28.43 10.31% 2017 3544 3299 2015 19.56 - 12.21% 2019 17.17 2020 1649 weer 21.1496 standard deviation 44.939 correlation coefficient covariance $10 profolio weighs protfolio retum Protfolio Standard Deviation 21.85% 40.79% 1 O 21.85% 6.4473 0.1 22.73% 66164 25 64% 0.663 07 00 27.53% 0.6445 06 04 06548 05 31.32% 0.6872 0.4 0.6 33.16% 0.6992 03 0. 35.11% 0.4707 02 08 16934 399 01 09 3 3467 0 ! 4076 0101 3403 AVERAGE 144 47 19.02 33.54 232 4747 102.33 21659 115.99% 169.70% 40.79 61.8290 0.0113220343 0.0021947751