

Question
Use the shared results from the Student Data Table and follow the instructions below.Devise a null and alternative hypothesis, then perform a one sample z-test

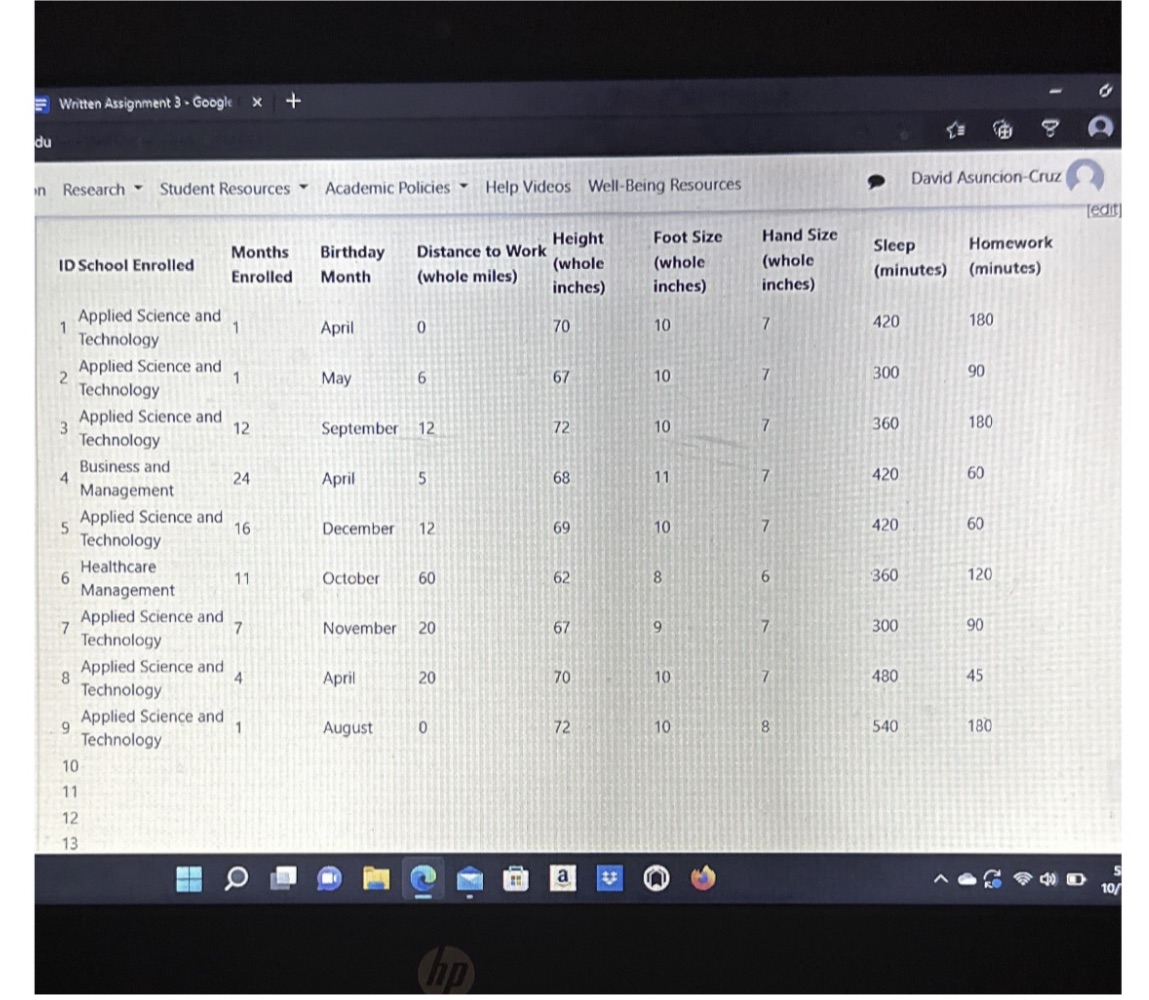
Use the shared results from the Student Data Table and follow the instructions below.Devise a null and alternative hypothesis, then perform a one sample z-test using alpha=0.05 if our class is taller or shorter than the average human in the United States. Graphically display your answer and statistically write up results. In addition, determine the effect size of this relationship and interpret. Notes:The average height of adults in the United States is 67.03.8 inches. (Note: this is a population SD)Calculate and interpret the effect size (use Cohen's d): Cohen's d = (Msample - population) ? ?)Devise a null and alternative hypothesis, then perform a t-test using alpha =0.05 if the students in our class that are born in warm weather months are taller or shorter than those born in cold weather months. Graphically display your answer and statistically write up results. In addition, determine the effect size of this relationship and interpret.Notes:Population SDs are unknown.Assume the northern hemisphere: Warm months = April, May, June, July, August, September Cold months = October, November, December, January, February, MarchUse Cohen's d effect size: Cohen's d = (M2 - M1) ? SDpooled) where SDpooled = ?((SD12 + SD22) ? 2)
Step by Step Solution
There are 3 Steps involved in it
Step: 1

Get Instant Access to Expert-Tailored Solutions
See step-by-step solutions with expert insights and AI powered tools for academic success
Step: 2

Step: 3
Ace Your Homework with AI
Get the answers you need in no time with our AI-driven, step-by-step assistance
Get Started
Income Tax Fundamentals 2013
Authors: Gerald E. Whittenburg, Martha Altus Buller, Steven L Gill
31st Edition
1111972516, 978-1285586618, 1285586611, 978-1285613109, 978-1111972516