

Question
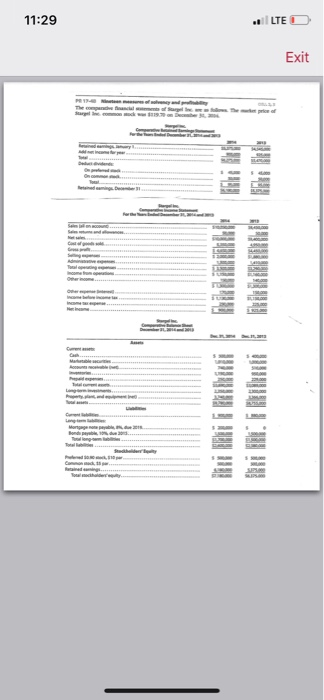
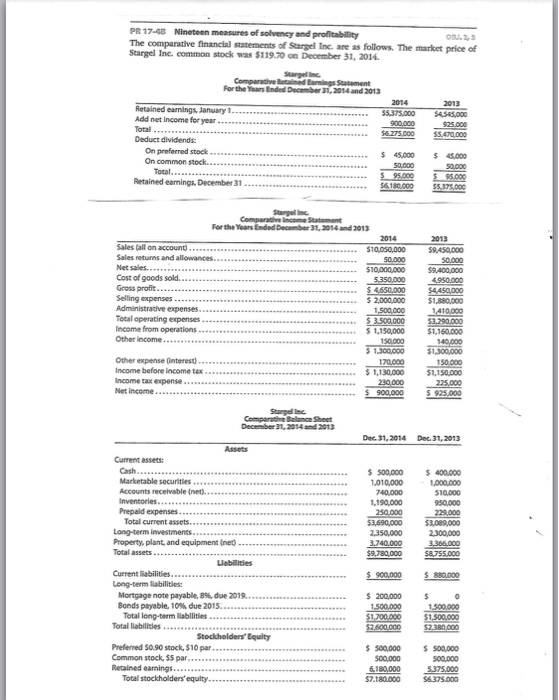
Use the Stargel Financial StatementsPreview the document to determine the following measures for 2014, rounding to to one decimal place, except per-share amounts, which should
Use the Stargel Financial StatementsPreview the document to determine the following measures for 2014, rounding to to one decimal place, except per-share amounts, which should be rounded to the nearest penny:
Working capital ($x,xxx)
Current ratio (x.x)
Quick ratio (x.x)
Accounts receivable turnover (x.x)
Number of days' sales in receivables (x.x)
Inventory turnover (x.x)
Number of days' sales in inventory (x.x)
Ratio of fixed assets to long-term liabilities (x.x)
Ratio of liabilities to stockholders' equity (x.x)
Number of times interest charges are earned (x.x)
Ratio of sales to assets (x.x)
Rate earned on total assets (x.x%)
Rate earned on stockholders' equity (x.x%)
Rate earned on common stockholders' equity (x.x%)
Earnings per share on common stock ($x.xx)
Price-earnings ratio (x.x)
Dividends per share of common stock ($x.xx)
Dividend yield (x.x%)
Step by Step Solution
There are 3 Steps involved in it
Step: 1

Get Instant Access to Expert-Tailored Solutions
See step-by-step solutions with expert insights and AI powered tools for academic success
Step: 2

Step: 3
Ace Your Homework with AI
Get the answers you need in no time with our AI-driven, step-by-step assistance
Get Started
Personal Trainer 3 0 Online For Albright/Ingram/Hills Managerial Accounting Information For Decisions
Authors: Thomas L. Albright, Robert W. Ingram, John S. Hill
4th Edition
0324233388, 978-0324233384