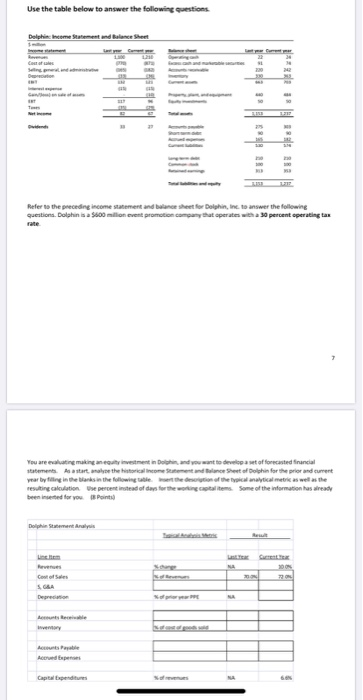
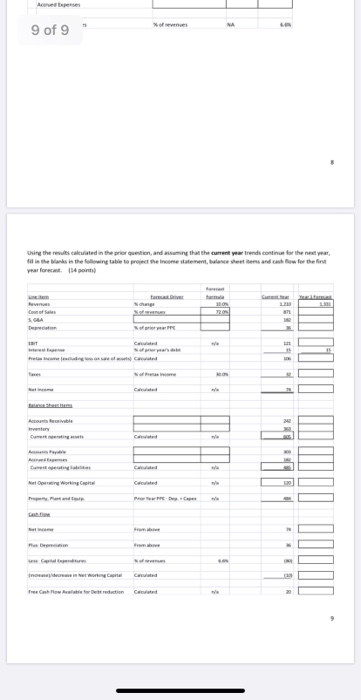
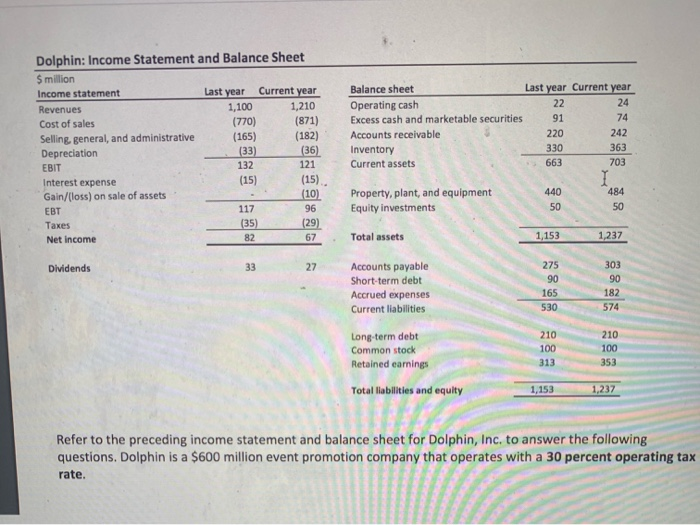
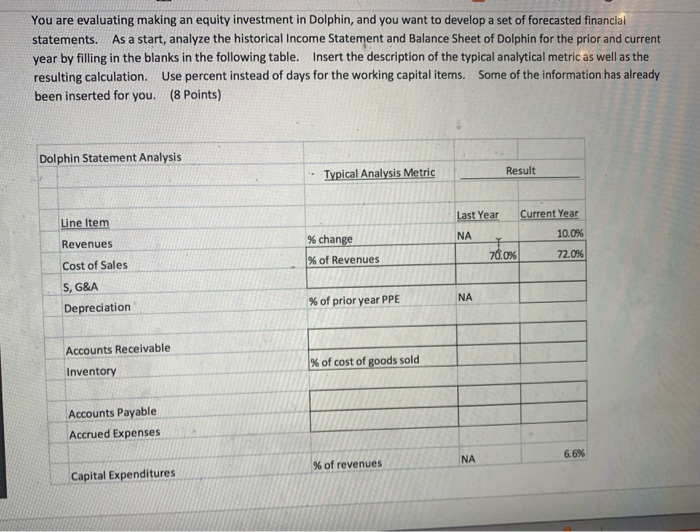
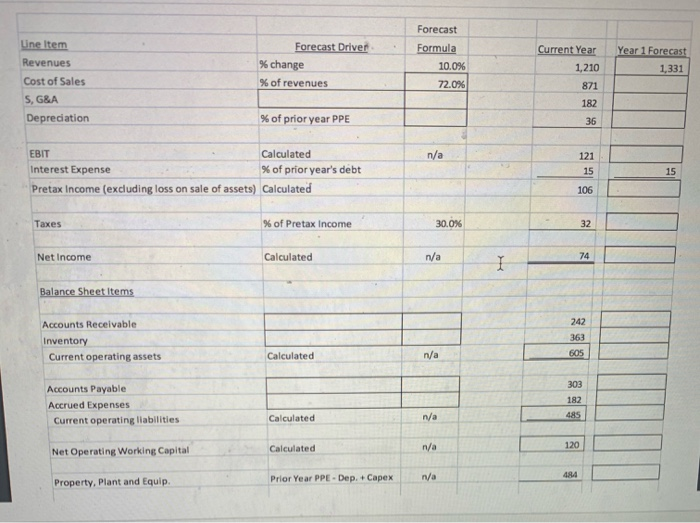
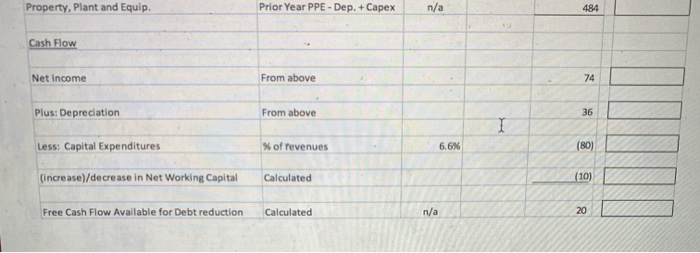
Use the table below to answer the following questions Els on Des i gn Ape 9 of 9 Dolphin: Income Statement and Balance Sheet Smillion Income statement Last year Current year Revenues 1,100 1,210 Cost of sales (770) (871) Selling general, and administrative (165) (182) Depreciation (33) (36) EBIT 132 121 Interest expense (15) (15) Gain/loss) on sale of assets (10) EBT 96 Taxes (35) (29) Net Income 67 Balance sheet Last year Current year Operating cash Excess cash and marketable securities Accounts receivable 220 Inventory Current assets 663 330 140 117 Property, plant, and equipment Equity investments Total assets 1,153 1,237 Dividends 27 303 Accounts payable Short-term debt Accrued expenses Current liabilities 530 210 Long-term debt Common stock Retained earnings 210 100 100 313 Total liabilities and equity Refer to the preceding income statement and balance sheet for Dolphin, Inc. to answer the following questions. Dolphin is a $600 million event promotion company that operates with a 30 percent operating tax rate. You are evaluating making an equity investment in Dolphin, and you want to develop a set of forecasted financial statements. As a start, analyze the historical Income Statement and Balance Sheet of Dolphin for the prior and current year by filling in the blanks in the following table. Insert the description of the typical analytical metric as well as the resulting calculation. Use percent instead of days for the working capital items. Some of the information has already been inserted for you. (8 Points) Dolphin Statement Analysis Typical Analysis Metric Result Last Year Line Item NA Current Year 10.0% 72.0% Revenues % change % of Revenues 76.0% Cost of Sales S, G&A Depreciation % of prior year PPE N A Accounts Receivable % of cost of goods sold Inventory Accounts Payable Accrued Expenses 6.6% % of revenues Capital Expenditures Line Item Revenues Cost of Sales S, G&A Depreciation Forecast Driver % change % of revenues Forecast Formula 10.0% 72.0% Year 1 Forecast 1,331 Current Year 1,210 871 182 36 % of prior year PPE n/a EBIT Calculated Interest Expense % of prior year's debt Pretax Income (excluding loss on sale of assets) Calculated 106 Taxes % of Pretax Income 30.0% Net Income Calculated n/a Balance Sheet Items Accounts Receivable Inventory Current operating assets Calculated n/a 605 Accounts Payable Accrued Expenses Current operating liabilities 303 182 485 Calculated Net Operating Working Capital Calculated 120 n/a Prior Year PPE - Dep. + Capex n/a 484 Property, Plant and Equip. Property. Plant and Equip. Prior Year PPE - Dep. + Capex n/a 484 Cash Flow Net Income From above Plus: Depreciation From above Less: Capital Expenditures % of revenues 6.6% (80) (increase)/decrease in Net Working Capital Calculated (10) Free Cash Flow Available for Debt reduction Calculated n/a 20
