

Answered step by step
Verified Expert Solution
Question
1 Approved Answer
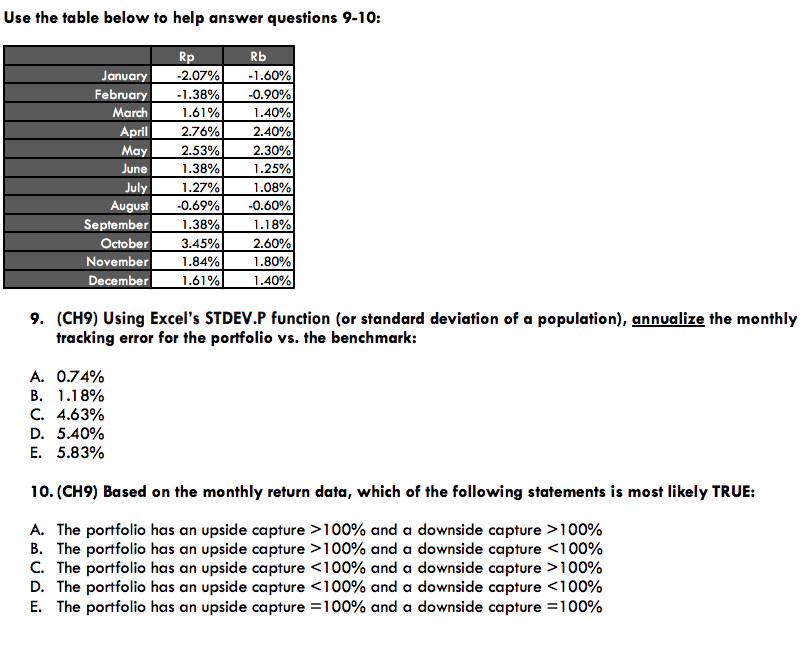
Use the table below to help answer questions 9-10: Rb January February March April 207% 1.38% 1.61% 2.76% 1 .60% -0.90% 1.40% 2.40% 1.38% June
Step by Step Solution
There are 3 Steps involved in it
Step: 1

Get Instant Access to Expert-Tailored Solutions
See step-by-step solutions with expert insights and AI powered tools for academic success
Step: 2

Step: 3
Ace Your Homework with AI
Get the answers you need in no time with our AI-driven, step-by-step assistance
Get Started
Forest Resource Economics And Finance
Authors: W. David Klemperer
1st Edition
0974021105, 978-0974021102