Use the tables below for the following:
Create a ratio analysis for each year (must use formulas) and provide a detailed analysis of them
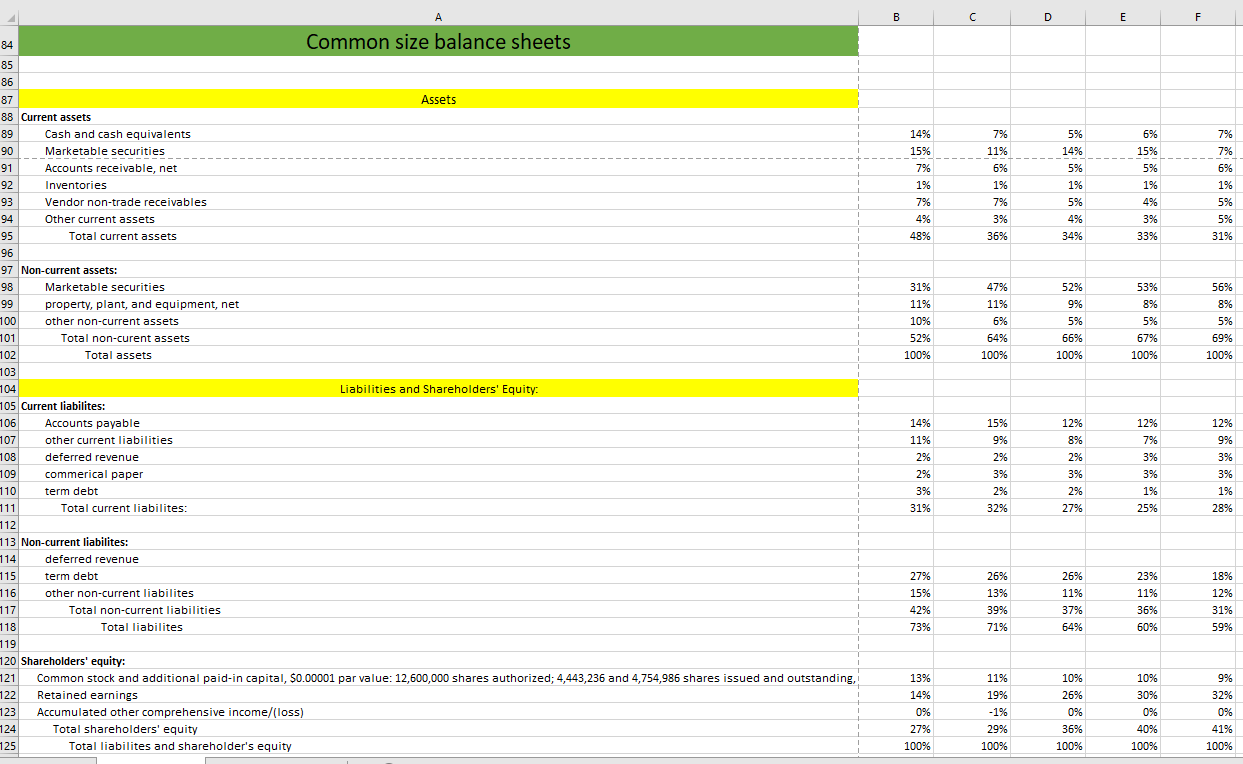
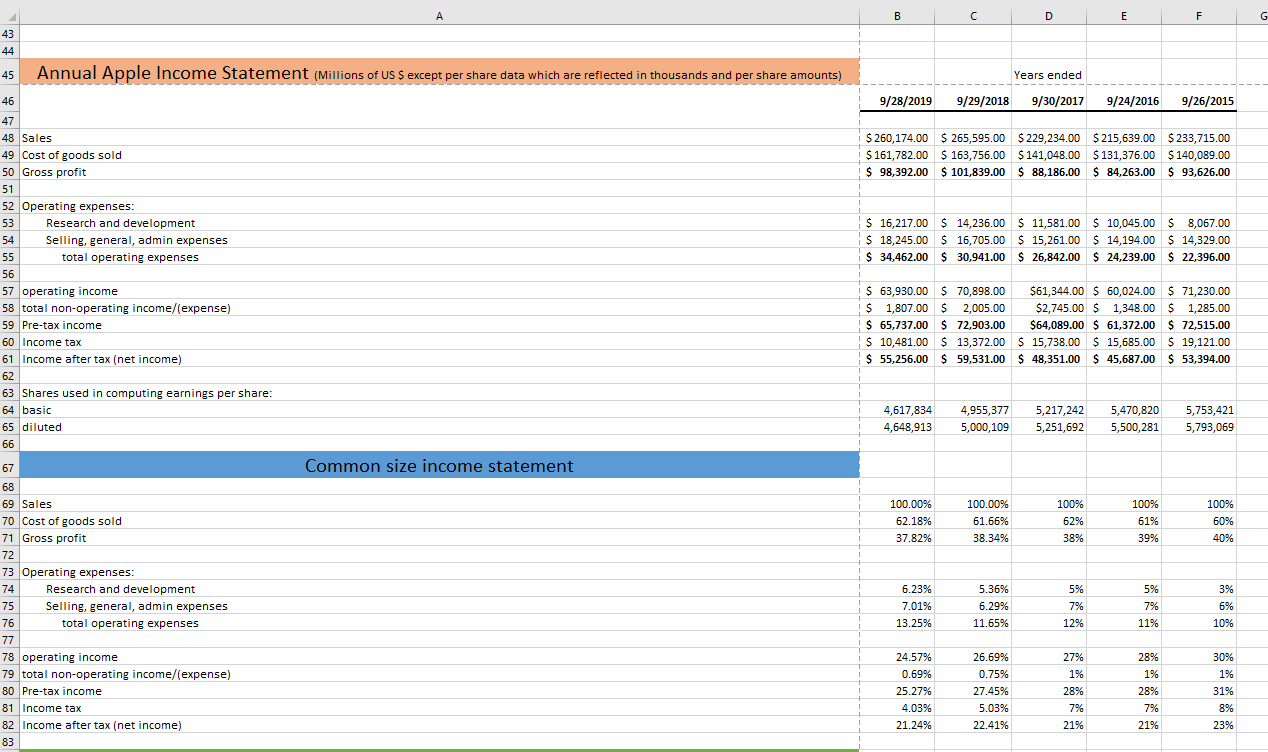
Provide a detailed analysis of the common sized financial statements
Create a discounted cashflow valuation for the company
Provide a "buy-sell-hold" recommendation based on results
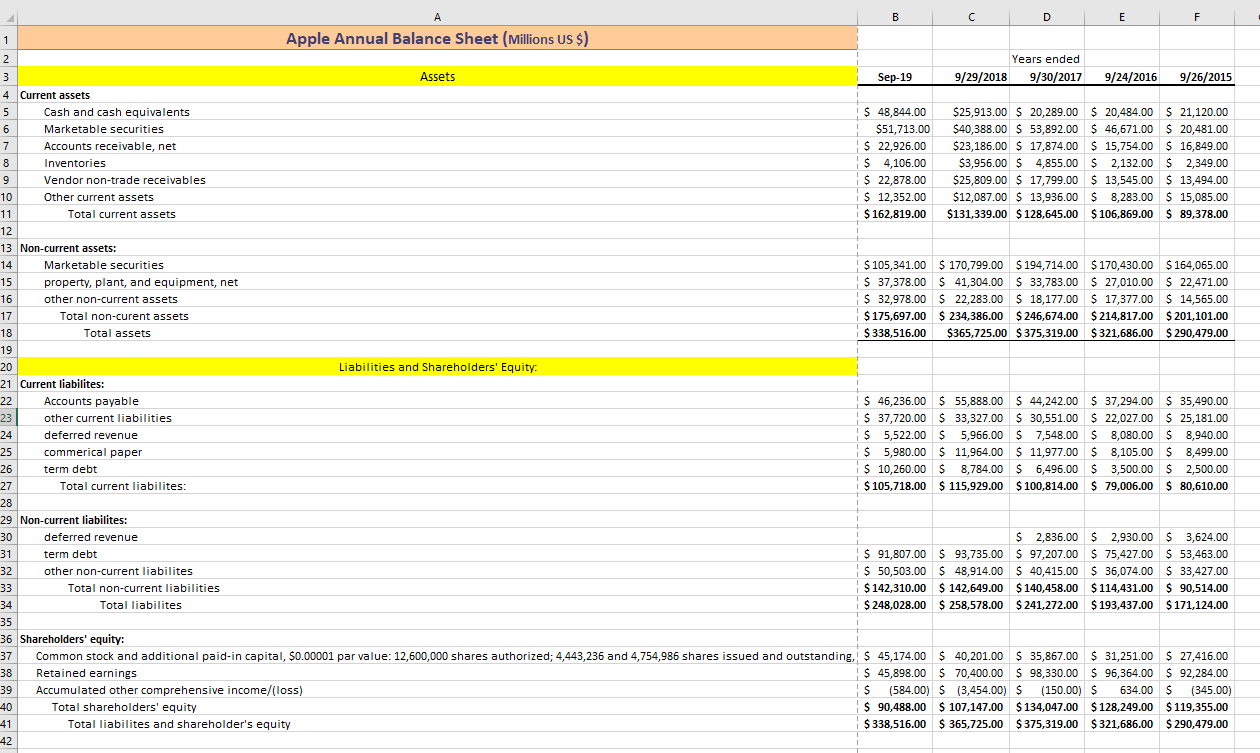
1 B C D E F Apple Annual Balance Sheet (Millions US $) 2 Years ended 3 Assets Sep-19 9/29/2018 9/30/2017 9/24/2016 9/26/2015 4 Current assets 5 Cash and cash equivalents $ 48,844.00 $25,913.00 $ 20,289.00 $ 20,484.00 $ 21,120.00 6 Marketable securities $51,713.00 $40,388.00 $ 53,892.00 $ 45,671.00 $ 20,481.00 7 7 Accounts receivable, net $ 22,926.00 $23,186.00 $ 17,874.00 $ 15,754.00 $ 16,849.00 8 Inventories $ 4,106.00 $3,956.00 $ 4,855.00 $ 2,132.00 $ 2,349.00 9 Vendor non-trade receivables $ 22,878.00 $25,809.00 $ 17,799.00 $ 13,545.00 $ 13,494.00 10 Other current assets $ 12,352.00 $12,087.00 $ 13,936.00 $ 8,283.00 $ 15,085.00 11 Total current assets $ 162,819.00 $131,339.00 $ 128,645.00 $ 106,869.00 $ 89,378.00 12 13 Non-current assets: 14 Marketable securities $ 105,341.00 $ 170,799.00 $ 194,714.00 $ 170,430.00 $164,065.00 15 property, plant, and equipment, net $ 37,378.00 $ 41,304.00 $ 33,783.00 $ 27,010.00 $ 22,471.00 16 other non-current assets $ 32,978.00 $ 22,283.00 $ 18,177.00 $ 17,377.00 $ 14,565.00 17 Total non-curent assets $ 175,697.00 $ 234,386.00 $ 246,674.00 $ 214,817.00 $ 201,101.00 18 Total assets $ 338,516.00 $365,725.00 $375,319.00 $ 321,686.00 $ 290,479.00 19 20 Liabilities and Shareholders' Equity: 21 Current liabilites: 22 Accounts payable $ 46,236.00 $ 55,888.00 $ 44,242.00 $ 37,294.00 $ 35,490.00 23 other current liabilities $ 37,720.00 $ 33,327.00 $ 30,551.00 $ 22,027.00 $ 25,181.00 24 deferred revenue $ 5,522.00 $ 5,966.00 $ 7,548.00 $ 8,080.00 $ 8.940.00 25 commerical paper $ 5,980.00 $ 11,964.00 $ 11,977.00 $ 8,105.00 $ 8,499.00 26 term debt $ 10,260.00 $ 8,784.00 $ 6,496.00 $ 3,500.00 $ 2,500.00 27 Total current liabilites: $ 105,718.00 $ 115,929.00 $ 100,814.00 $ 79,006.00 $ 80,610.00 28 29 Non-current liabilites: 30 deferred revenue $ 2,836.00 $ 2,930.00 $ 3,624.00 31 term debt $ 91,807.00 $ 93,735.00 $ 97,207.00 $ 75,427.00 $ 53,463.00 32 other non-current liabilites $ 50,503.00 $ 48,914.00 $ 40,415.00 $ 36,074.00 $ 33,427.00 33 Total non-current liabilities $ 142,310.00 $ 142,649.00 $ 140,458.00 $ 114,431.00 $ 90,514.00 34 Total liabilites $ 248,028.00 $ 258,578.00 $ 241,272.00 $ 193,437.00 $171,124.00 35 36 Shareholders' equity: 37 Common stock and additional paid-in capital, $0.00001 par value: 12,600,000 shares authorized; 4,443,236 and 4,754,986 shares issued and outstanding, $ 45,174.00 $ 40,201.00 $ 35,867.00 $ 31,251.00 $ 27,416.00 38 Retained earnings $ 45,898.00 $ 70,400.00 $ 98,330.00 $ 96,364.00 $ 92,284.00 39 Accumulated other comprehensive income/(loss) S (584.00) $ (3,454.00) $ (150.00) $ 634.00 $ (345.00) 40 Total shareholders' equity $ 90,488.00 $ 107,147.00 $ 134,047.00 $ 128,249.00 $ 119,355.00 41 Total liabilites and shareholder's equity $ 338,516.00 $365,725.00 $375,319.00 $ 321,686.00 $ 290,479.00 42 B D E F 14% 15% 7% 1% 7% 4% 48% 7% 11% 6% 1% 7% 3% 5% 14% 5% 1% 5% 4% 34% 6% 15% 5% 1% 4% 7% 7% 6% 1% 5% 5% 31% 3% 33% 36% 47% 31% 11% 10% 52% 100% 11% 6% 64% 100% 52% 9% 5% 66% 100% 53% 8% 5% 67% 100% 56% 8% 5% 69% 100% 84 Common size balance sheets 85 86 87 Assets 88 Current assets 89 Cash and cash equivalents 90 Marketable securities 91 Accounts receivable, net 92 Inventories 93 Vendor non-trade receivables 94 Other current assets 95 Total current assets 96 97 Non-current assets: 98 Marketable securities 99 property, plant, and equipment, net 100 other non-current assets 101 Total non-curent assets 102 Total assets 103 104 Liabilities and Shareholders' Equity: 105 Current liabilites: 106 Accounts payable 107 other current liabilities 108 deferred revenue 109 commerical paper 110 term debt 111 Total current liabilites: 112 113 Non-current liabilites: 114 deferred revenue 115 term debt 116 other non-current liabilites 117 Total non-current liabilities 118 Total liabilites 119 120 Shareholders' equity: 121 Common stock and additional paid-in capital, $0.00001 par value: 12,600,000 shares authorized; 4,443,236 and 4,754,986 shares issued and outstanding, 122 Retained earnings 123 Accumulated other comprehensive income/(loss) 124 Total shareholders' equity 125 Total liabilites and shareholder's equity 14% 11% 2% 2% 3% 31% 15% 9% 2% 3% 2% 32% 12% 8% 2% 3% 2% 27% 12% 7% 3% 3% 1% 25% 12% 9% 3% 3% 1% 28% 27% 15% 42% 73% 26% 13% 39% 71% 26% 11% 37% 64% 23% 11% 36% 60% 18% 12% 31% 59% 13% 14% 0% 27% 100% 11% 19% - 1% 29% 100% 10% 26% 0% 36% 100% 10% 30% 0% 9% 32% 0% 41% 100% 40% 100% . B C D E F G 43 44 45 Annual Apple Income Statement (Millions of US $ except per share data which are reflected in thousands and per share amounts) Years ended 46 9/28/2019 9/29/2018 9/30/2017 9/24/2016 9/26/2015 $ 260,174.00 $ 265,595.00 $ 229,234.00 $ 215,639.00 $ 233,715.00 $ 161,782.00 $ 163,756.00 $ 141,048.00 $ 131,376.00 $ 140,089.00 $ 98,392.00 $ 101,839.00 $ 88,186.00 $ 84,263.00 $ 93,626.00 $ 16,217.00 $ 14,236.00 $ 11,581.00 $ 10,045.00 $ 8,067.00 $ 18,245.00 $ 16,705.00 $ 15,261.00 $ 14,194.00 $ 14,329.00 $ 34,462.00 $ 30,941.00 $ 26,842.00 $ 24,239.00 $ 22,396.00 47 48 Sales 49 Cost of goods sold 50 Gross profit 51 52 Operating expenses: 53 Research and development 54 Selling, general, admin expenses 55 total operating expenses 56 57 operating income 58 total non-operating income/(expense) 59 Pre-tax income 60 Income tax 61 Income after tax (net income) 62 63 Shares used in computing earnings per share: 64 basic 65 diluted 66 $ 63,930.00 $ 70,898.00 $61,344.00 $ 60,024.00 $ 71,230.00 $ 1,807.00 $ 2,005.00 $2,745.00 $ 1,348.00 $ 1,285.00 $ 65,737.00 $ 72,903.00 $64,089.00 $ 61,372.00 $ 72,515.00 $ 10,481.00 $13,372.00 $ 15,738.00 $ 15,685.00 $ 19,121.00 $ 55,256.00 $ 59,531.00 $ 48,351.00 $ 45,687.00 $ 53,394.00 4,617,834 4,648,913 4,955,377 5,000,109 5,217,242 5,251,692 5,470,820 5,500,281 5,753,421 5,793,069 67 Common size income statement 100.00% 62.18% 37.82% 100.00% 61.66% 38.34% 100% 62% 38% 100% 61% 39% 100% 60% 40% 68 69 Sales 70 Cost of goods sold 71 Gross profit 72 73 Operating expenses: 74 Research and development 75 Selling, general, admin expenses 76 total operating expenses 77 78 operating income 79 total non-operating income/(expense) 80 Pre-tax income 81 Income tax 82 Income after tax (net income) 83 6.23% 7.01% 13.25% 5.36% 6.29% 11.65% 5% 7% 12% 5% 7% 11% 3% 6% 10% 24.57% 0.69% 25.27% 4.03% 21.24% 26.69% 0.75% 27.45% 5.03% 22.41% 27% 1% 28% 7% 21% 28% 1% 28% 7% 21% 30% 1% 31% 8% 23% 1 B C D E F Apple Annual Balance Sheet (Millions US $) 2 Years ended 3 Assets Sep-19 9/29/2018 9/30/2017 9/24/2016 9/26/2015 4 Current assets 5 Cash and cash equivalents $ 48,844.00 $25,913.00 $ 20,289.00 $ 20,484.00 $ 21,120.00 6 Marketable securities $51,713.00 $40,388.00 $ 53,892.00 $ 45,671.00 $ 20,481.00 7 7 Accounts receivable, net $ 22,926.00 $23,186.00 $ 17,874.00 $ 15,754.00 $ 16,849.00 8 Inventories $ 4,106.00 $3,956.00 $ 4,855.00 $ 2,132.00 $ 2,349.00 9 Vendor non-trade receivables $ 22,878.00 $25,809.00 $ 17,799.00 $ 13,545.00 $ 13,494.00 10 Other current assets $ 12,352.00 $12,087.00 $ 13,936.00 $ 8,283.00 $ 15,085.00 11 Total current assets $ 162,819.00 $131,339.00 $ 128,645.00 $ 106,869.00 $ 89,378.00 12 13 Non-current assets: 14 Marketable securities $ 105,341.00 $ 170,799.00 $ 194,714.00 $ 170,430.00 $164,065.00 15 property, plant, and equipment, net $ 37,378.00 $ 41,304.00 $ 33,783.00 $ 27,010.00 $ 22,471.00 16 other non-current assets $ 32,978.00 $ 22,283.00 $ 18,177.00 $ 17,377.00 $ 14,565.00 17 Total non-curent assets $ 175,697.00 $ 234,386.00 $ 246,674.00 $ 214,817.00 $ 201,101.00 18 Total assets $ 338,516.00 $365,725.00 $375,319.00 $ 321,686.00 $ 290,479.00 19 20 Liabilities and Shareholders' Equity: 21 Current liabilites: 22 Accounts payable $ 46,236.00 $ 55,888.00 $ 44,242.00 $ 37,294.00 $ 35,490.00 23 other current liabilities $ 37,720.00 $ 33,327.00 $ 30,551.00 $ 22,027.00 $ 25,181.00 24 deferred revenue $ 5,522.00 $ 5,966.00 $ 7,548.00 $ 8,080.00 $ 8.940.00 25 commerical paper $ 5,980.00 $ 11,964.00 $ 11,977.00 $ 8,105.00 $ 8,499.00 26 term debt $ 10,260.00 $ 8,784.00 $ 6,496.00 $ 3,500.00 $ 2,500.00 27 Total current liabilites: $ 105,718.00 $ 115,929.00 $ 100,814.00 $ 79,006.00 $ 80,610.00 28 29 Non-current liabilites: 30 deferred revenue $ 2,836.00 $ 2,930.00 $ 3,624.00 31 term debt $ 91,807.00 $ 93,735.00 $ 97,207.00 $ 75,427.00 $ 53,463.00 32 other non-current liabilites $ 50,503.00 $ 48,914.00 $ 40,415.00 $ 36,074.00 $ 33,427.00 33 Total non-current liabilities $ 142,310.00 $ 142,649.00 $ 140,458.00 $ 114,431.00 $ 90,514.00 34 Total liabilites $ 248,028.00 $ 258,578.00 $ 241,272.00 $ 193,437.00 $171,124.00 35 36 Shareholders' equity: 37 Common stock and additional paid-in capital, $0.00001 par value: 12,600,000 shares authorized; 4,443,236 and 4,754,986 shares issued and outstanding, $ 45,174.00 $ 40,201.00 $ 35,867.00 $ 31,251.00 $ 27,416.00 38 Retained earnings $ 45,898.00 $ 70,400.00 $ 98,330.00 $ 96,364.00 $ 92,284.00 39 Accumulated other comprehensive income/(loss) S (584.00) $ (3,454.00) $ (150.00) $ 634.00 $ (345.00) 40 Total shareholders' equity $ 90,488.00 $ 107,147.00 $ 134,047.00 $ 128,249.00 $ 119,355.00 41 Total liabilites and shareholder's equity $ 338,516.00 $365,725.00 $375,319.00 $ 321,686.00 $ 290,479.00 42 B D E F 14% 15% 7% 1% 7% 4% 48% 7% 11% 6% 1% 7% 3% 5% 14% 5% 1% 5% 4% 34% 6% 15% 5% 1% 4% 7% 7% 6% 1% 5% 5% 31% 3% 33% 36% 47% 31% 11% 10% 52% 100% 11% 6% 64% 100% 52% 9% 5% 66% 100% 53% 8% 5% 67% 100% 56% 8% 5% 69% 100% 84 Common size balance sheets 85 86 87 Assets 88 Current assets 89 Cash and cash equivalents 90 Marketable securities 91 Accounts receivable, net 92 Inventories 93 Vendor non-trade receivables 94 Other current assets 95 Total current assets 96 97 Non-current assets: 98 Marketable securities 99 property, plant, and equipment, net 100 other non-current assets 101 Total non-curent assets 102 Total assets 103 104 Liabilities and Shareholders' Equity: 105 Current liabilites: 106 Accounts payable 107 other current liabilities 108 deferred revenue 109 commerical paper 110 term debt 111 Total current liabilites: 112 113 Non-current liabilites: 114 deferred revenue 115 term debt 116 other non-current liabilites 117 Total non-current liabilities 118 Total liabilites 119 120 Shareholders' equity: 121 Common stock and additional paid-in capital, $0.00001 par value: 12,600,000 shares authorized; 4,443,236 and 4,754,986 shares issued and outstanding, 122 Retained earnings 123 Accumulated other comprehensive income/(loss) 124 Total shareholders' equity 125 Total liabilites and shareholder's equity 14% 11% 2% 2% 3% 31% 15% 9% 2% 3% 2% 32% 12% 8% 2% 3% 2% 27% 12% 7% 3% 3% 1% 25% 12% 9% 3% 3% 1% 28% 27% 15% 42% 73% 26% 13% 39% 71% 26% 11% 37% 64% 23% 11% 36% 60% 18% 12% 31% 59% 13% 14% 0% 27% 100% 11% 19% - 1% 29% 100% 10% 26% 0% 36% 100% 10% 30% 0% 9% 32% 0% 41% 100% 40% 100% . B C D E F G 43 44 45 Annual Apple Income Statement (Millions of US $ except per share data which are reflected in thousands and per share amounts) Years ended 46 9/28/2019 9/29/2018 9/30/2017 9/24/2016 9/26/2015 $ 260,174.00 $ 265,595.00 $ 229,234.00 $ 215,639.00 $ 233,715.00 $ 161,782.00 $ 163,756.00 $ 141,048.00 $ 131,376.00 $ 140,089.00 $ 98,392.00 $ 101,839.00 $ 88,186.00 $ 84,263.00 $ 93,626.00 $ 16,217.00 $ 14,236.00 $ 11,581.00 $ 10,045.00 $ 8,067.00 $ 18,245.00 $ 16,705.00 $ 15,261.00 $ 14,194.00 $ 14,329.00 $ 34,462.00 $ 30,941.00 $ 26,842.00 $ 24,239.00 $ 22,396.00 47 48 Sales 49 Cost of goods sold 50 Gross profit 51 52 Operating expenses: 53 Research and development 54 Selling, general, admin expenses 55 total operating expenses 56 57 operating income 58 total non-operating income/(expense) 59 Pre-tax income 60 Income tax 61 Income after tax (net income) 62 63 Shares used in computing earnings per share: 64 basic 65 diluted 66 $ 63,930.00 $ 70,898.00 $61,344.00 $ 60,024.00 $ 71,230.00 $ 1,807.00 $ 2,005.00 $2,745.00 $ 1,348.00 $ 1,285.00 $ 65,737.00 $ 72,903.00 $64,089.00 $ 61,372.00 $ 72,515.00 $ 10,481.00 $13,372.00 $ 15,738.00 $ 15,685.00 $ 19,121.00 $ 55,256.00 $ 59,531.00 $ 48,351.00 $ 45,687.00 $ 53,394.00 4,617,834 4,648,913 4,955,377 5,000,109 5,217,242 5,251,692 5,470,820 5,500,281 5,753,421 5,793,069 67 Common size income statement 100.00% 62.18% 37.82% 100.00% 61.66% 38.34% 100% 62% 38% 100% 61% 39% 100% 60% 40% 68 69 Sales 70 Cost of goods sold 71 Gross profit 72 73 Operating expenses: 74 Research and development 75 Selling, general, admin expenses 76 total operating expenses 77 78 operating income 79 total non-operating income/(expense) 80 Pre-tax income 81 Income tax 82 Income after tax (net income) 83 6.23% 7.01% 13.25% 5.36% 6.29% 11.65% 5% 7% 12% 5% 7% 11% 3% 6% 10% 24.57% 0.69% 25.27% 4.03% 21.24% 26.69% 0.75% 27.45% 5.03% 22.41% 27% 1% 28% 7% 21% 28% 1% 28% 7% 21% 30% 1% 31% 8% 23%