

Answered step by step
Verified Expert Solution
Question
1 Approved Answer
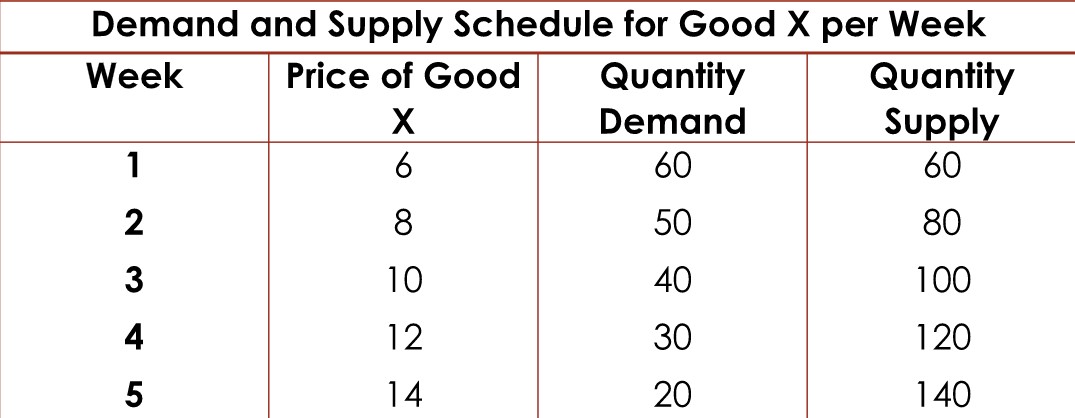
Use the values in the table below to calculate for equilibrium quantity and equilibrium price between week 3 and 4. Demand and Supply Schedule for

- Use the values in the table below to calculate for equilibrium quantity and equilibrium price between week 3 and 4.
Step by Step Solution
There are 3 Steps involved in it
Step: 1

Get Instant Access to Expert-Tailored Solutions
See step-by-step solutions with expert insights and AI powered tools for academic success
Step: 2

Step: 3
Ace Your Homework with AI
Get the answers you need in no time with our AI-driven, step-by-step assistance
Get Started
College Mathematics for Business Economics Life Sciences and Social Sciences
Authors: Raymond A. Barnett, Michael R. Ziegler, Karl E. Byleen
12th edition
321614003, 978-0321614001