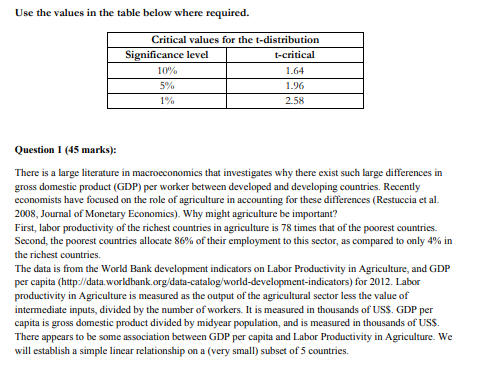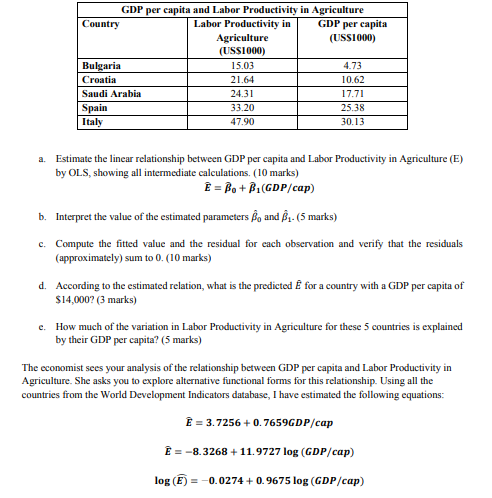

Use the values in the table below where required. Critical values for the t-distribution Significance level t-critical 10% 1.64 5% 1.96 1% 2.58 Question 1 (45 marks): There is a large literature in macroeconomics that investigates why there exist such large differences in gross domestic product (GDP) per worker between developed and developing countries. Recently economists have focused on the role of agriculture in accounting for these differences (Restuccia et al. 2008, Journal of Monetary Economics). Why might agriculture be important? First, labor productivity of the richest countries in agriculture is 78 times that of the poorest countries. Second, the poorest countries allocate 86% of their employment to this sector, as compared to only 4% in the richest countries. The data is from the World Bank development indicators on Labor Productivity in Agriculture, and GDP per capita (http://data.worldbank.org/data-catalog/world-development-indicators) for 2012. Labor productivity in Agriculture is measured as the output of the agricultural sector less the value of intermediate inputs, divided by the number of workers. It is measured in thousands of USS. GDP per capita is gross domestic product divided by midyear population, and is measured in thousands of USS. There appears to be some association between GDP per capita and Labor Productivity in Agriculture. We will establish a simple linear relationship on a (very small) subset of 5 countries. GDP per capita and Labor Productivity in Agriculture Country Labor Productivity in GDP per capita Agriculture (USS1000) (US$1000) Bulgaria 15.03 4.73 Croatia 21.64 10.62 Saudi Arabia 24.31 17.71 Spain 33.20 25.38 Italy 47.90 30.13 a. Estimate the linear relationship between GDP per capita and Labor Productivity in Agriculture (E) by OLS, showing all intermediate calculations. (10 marks) E = Bo+B.(GDP/cap) b. Interpret the value of the estimated parameters and R. (5 marks) c. Compute the fitted value and the residual for each observation and verify that the residuals (approximately) sum to 0. (10 marks) d. According to the estimated relation, what is the predicted for a country with a GDP per capita of $14,000? (3 marks) e. How much of the variation in Labor Productivity in Agriculture for these 5 countries is explained by their GDP per capita? (5 marks) The economist sees your analysis of the relationship between GDP per capita and Labor Productivity in Agriculture. She asks you to explore alternative functional forms for this relationship. Using all the countries from the World Development Indicators database, I have estimated the following equations: = 3.7256 +0.7659GDP/cap E = -8.3268 +11.9727 log (GDP/cap) log (E) = -0.0274 +0.9675 log (GDP/cap) Use the values in the table below where required. Critical values for the t-distribution Significance level t-critical 10% 1.64 5% 1.96 1% 2.58 Question 1 (45 marks): There is a large literature in macroeconomics that investigates why there exist such large differences in gross domestic product (GDP) per worker between developed and developing countries. Recently economists have focused on the role of agriculture in accounting for these differences (Restuccia et al. 2008, Journal of Monetary Economics). Why might agriculture be important? First, labor productivity of the richest countries in agriculture is 78 times that of the poorest countries. Second, the poorest countries allocate 86% of their employment to this sector, as compared to only 4% in the richest countries. The data is from the World Bank development indicators on Labor Productivity in Agriculture, and GDP per capita (http://data.worldbank.org/data-catalog/world-development-indicators) for 2012. Labor productivity in Agriculture is measured as the output of the agricultural sector less the value of intermediate inputs, divided by the number of workers. It is measured in thousands of USS. GDP per capita is gross domestic product divided by midyear population, and is measured in thousands of USS. There appears to be some association between GDP per capita and Labor Productivity in Agriculture. We will establish a simple linear relationship on a (very small) subset of 5 countries. GDP per capita and Labor Productivity in Agriculture Country Labor Productivity in GDP per capita Agriculture (USS1000) (US$1000) Bulgaria 15.03 4.73 Croatia 21.64 10.62 Saudi Arabia 24.31 17.71 Spain 33.20 25.38 Italy 47.90 30.13 a. Estimate the linear relationship between GDP per capita and Labor Productivity in Agriculture (E) by OLS, showing all intermediate calculations. (10 marks) E = Bo+B.(GDP/cap) b. Interpret the value of the estimated parameters and R. (5 marks) c. Compute the fitted value and the residual for each observation and verify that the residuals (approximately) sum to 0. (10 marks) d. According to the estimated relation, what is the predicted for a country with a GDP per capita of $14,000? (3 marks) e. How much of the variation in Labor Productivity in Agriculture for these 5 countries is explained by their GDP per capita? (5 marks) The economist sees your analysis of the relationship between GDP per capita and Labor Productivity in Agriculture. She asks you to explore alternative functional forms for this relationship. Using all the countries from the World Development Indicators database, I have estimated the following equations: = 3.7256 +0.7659GDP/cap E = -8.3268 +11.9727 log (GDP/cap) log (E) = -0.0274 +0.9675 log (GDP/cap)


