use this information below to solve the chart I have put down at the bottom! if you could please show all your work so I can figure it out that would be awesome. I am really stuck on this and have a huge test coming up. The more info the better! Thank you!
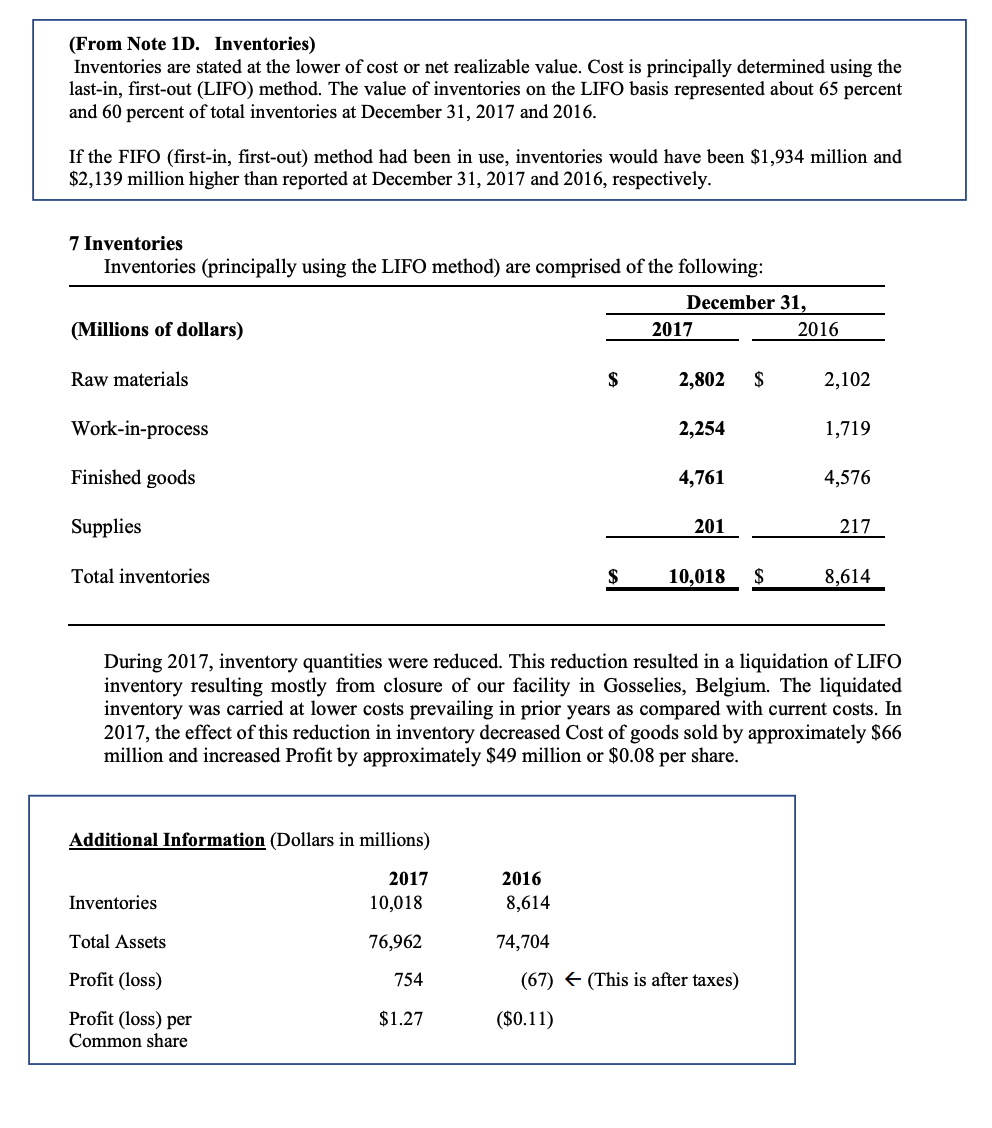
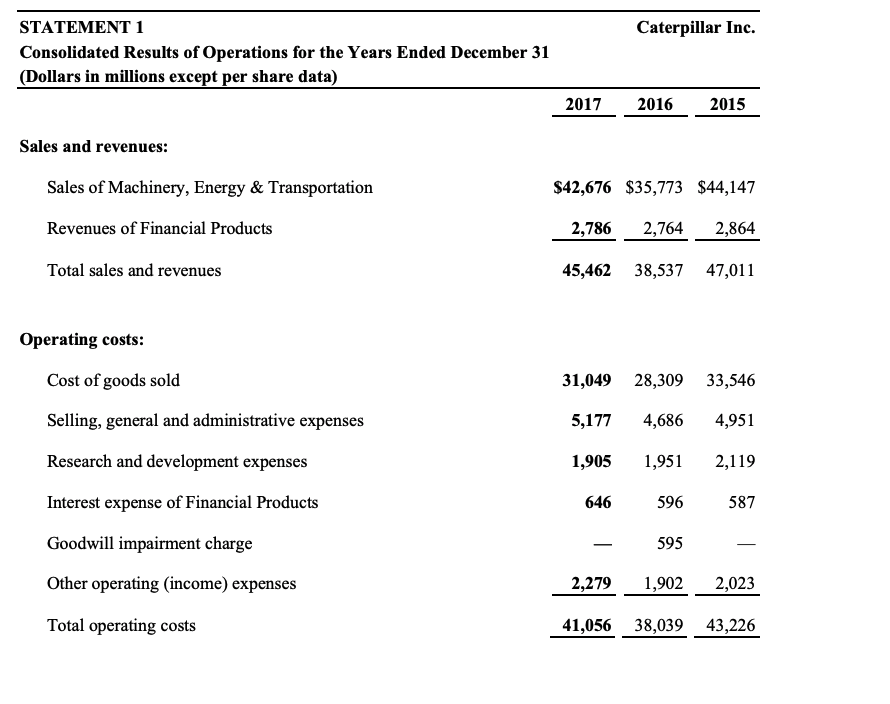
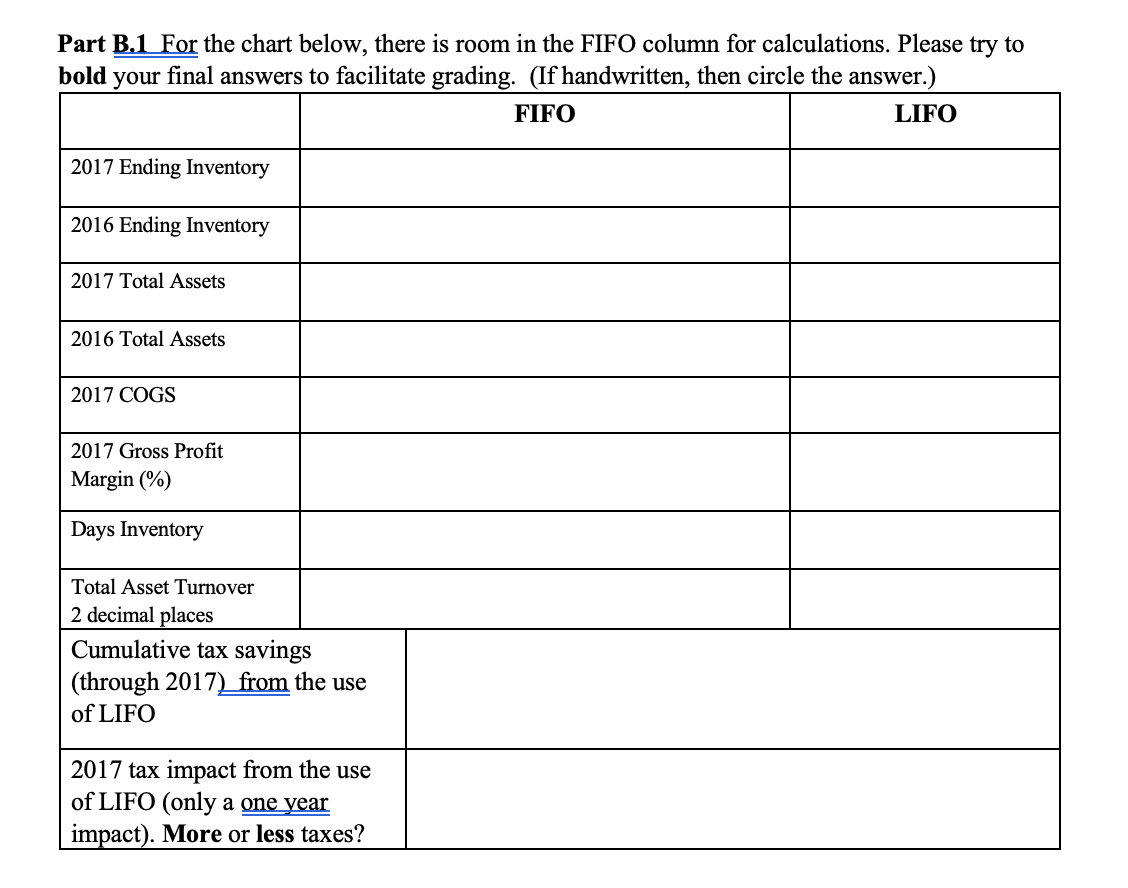
(From Note 1D. Inventories) Inventories are stated at the lower of cost or net realizable value. Cost is principally determined using the last-in, first-out (LIFO) method. The value of inventories on the LIFO basis represented about 65 percent and 60 percent of total inventories at December 31, 2017 and 2016. If the FIFO (first-in, first-out) method had been in use, inventories would have been $1,934 million and $2,139 million higher than reported at December 31, 2017 and 2016, respectively. 7 Inventories Inventories (principally using the LIFO method) are comprised of the following: December 31, (Millions of dollars) _ 2017 _ 2016 Raw materials $ 2,802 $ 2,102 Work-in-process 2,254 1,719 Finished goods 4,761 4,576 Supplies 217 | 201 10,018 Total inventories $ $ 8,614 During 2017, inventory quantities were reduced. This reduction resulted in a liquidation of LIFO inventory resulting mostly from closure of our facility in Gosselies, Belgium. The liquidated inventory was carried at lower costs prevailing in prior years as compared with current costs. In 2017, the effect of this reduction in inventory decreased Cost of goods sold by approximately $66 million and increased Profit by approximately $49 million or $0.08 per share. Additional Information (Dollars in millions) 2017 10,018 2016 8,614 Inventories Total Assets 76,962 74,704 (67) + (This is after taxes) Profit (loss) 754 $1.27 Profit (loss) per Common share ($0.11) Caterpillar Inc. STATEMENT 1 Consolidated Results of Operations for the Years Ended December 31 (Dollars in millions except per share data) 2017 2016 2015 Sales and revenues: Sales of Machinery, Energy & Transportation $42,676 $35,773 $44,147 Revenues of Financial Products 2,786 2,764 2,864 Total sales and revenues 45,462 38,537 47,011 Operating costs: Cost of goods sold 31,049 28,309 33,546 Selling, general and administrative expenses 5,177 4,686 4,951 Research and development expenses Interest expense of Financial Products 1,905 646 - 2,279 1,951 596 595 1,902 2,119 587 - 2,023 Goodwill impairment charge Other operating (income) expenses Total operating costs 41,056 38,039 43,226 Part B.1 For the chart below, there is room in the FIFO column for calculations. Please try to bold your final answers to facilitate grading. (If handwritten, then circle the answer.) FIFO LIFO 2017 Ending Inventory entory 2016 Ending Inventory 2017 Total Assets 2016 Total Assets 2017 COGS 2017 Gross Profit Margin (%) Days Inventory Total Asset Turnover 2 decimal places Cumulative tax savings (through 2017) from the use of LIFO 2017 tax impact from the use of LIFO (only a one year impact). More or less taxes? (From Note 1D. Inventories) Inventories are stated at the lower of cost or net realizable value. Cost is principally determined using the last-in, first-out (LIFO) method. The value of inventories on the LIFO basis represented about 65 percent and 60 percent of total inventories at December 31, 2017 and 2016. If the FIFO (first-in, first-out) method had been in use, inventories would have been $1,934 million and $2,139 million higher than reported at December 31, 2017 and 2016, respectively. 7 Inventories Inventories (principally using the LIFO method) are comprised of the following: December 31, (Millions of dollars) _ 2017 _ 2016 Raw materials $ 2,802 $ 2,102 Work-in-process 2,254 1,719 Finished goods 4,761 4,576 Supplies 217 | 201 10,018 Total inventories $ $ 8,614 During 2017, inventory quantities were reduced. This reduction resulted in a liquidation of LIFO inventory resulting mostly from closure of our facility in Gosselies, Belgium. The liquidated inventory was carried at lower costs prevailing in prior years as compared with current costs. In 2017, the effect of this reduction in inventory decreased Cost of goods sold by approximately $66 million and increased Profit by approximately $49 million or $0.08 per share. Additional Information (Dollars in millions) 2017 10,018 2016 8,614 Inventories Total Assets 76,962 74,704 (67) + (This is after taxes) Profit (loss) 754 $1.27 Profit (loss) per Common share ($0.11) Caterpillar Inc. STATEMENT 1 Consolidated Results of Operations for the Years Ended December 31 (Dollars in millions except per share data) 2017 2016 2015 Sales and revenues: Sales of Machinery, Energy & Transportation $42,676 $35,773 $44,147 Revenues of Financial Products 2,786 2,764 2,864 Total sales and revenues 45,462 38,537 47,011 Operating costs: Cost of goods sold 31,049 28,309 33,546 Selling, general and administrative expenses 5,177 4,686 4,951 Research and development expenses Interest expense of Financial Products 1,905 646 - 2,279 1,951 596 595 1,902 2,119 587 - 2,023 Goodwill impairment charge Other operating (income) expenses Total operating costs 41,056 38,039 43,226 Part B.1 For the chart below, there is room in the FIFO column for calculations. Please try to bold your final answers to facilitate grading. (If handwritten, then circle the answer.) FIFO LIFO 2017 Ending Inventory entory 2016 Ending Inventory 2017 Total Assets 2016 Total Assets 2017 COGS 2017 Gross Profit Margin (%) Days Inventory Total Asset Turnover 2 decimal places Cumulative tax savings (through 2017) from the use of LIFO 2017 tax impact from the use of LIFO (only a one year impact). More or less taxes