Use Walmarts 2018 Annual report to find the following items for the 2018 fiscal year. Include in each answer the page of the annual report where your answer was found.
1. Walmarts Fiscal Year End (month, day, & year)
January, 31 2018
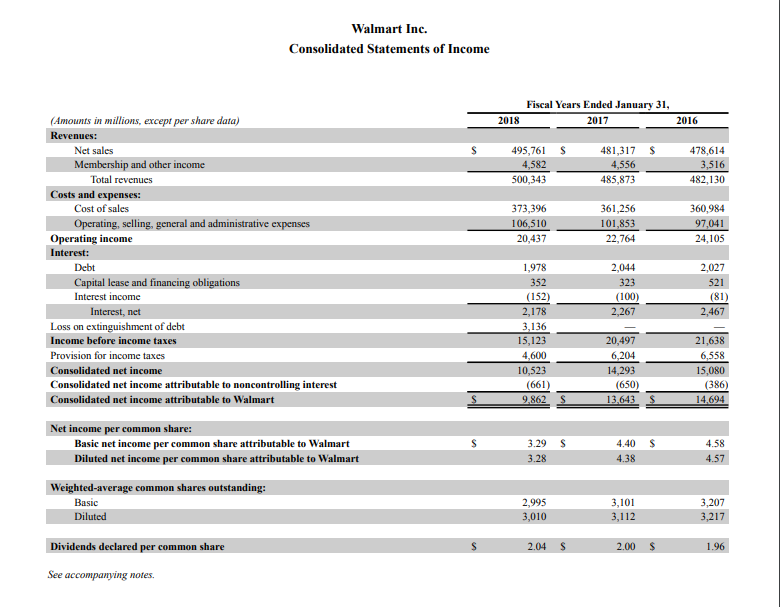
2. Total revenues
3. Total cost of sales
4. Total operating, selling, general & administrative expenses
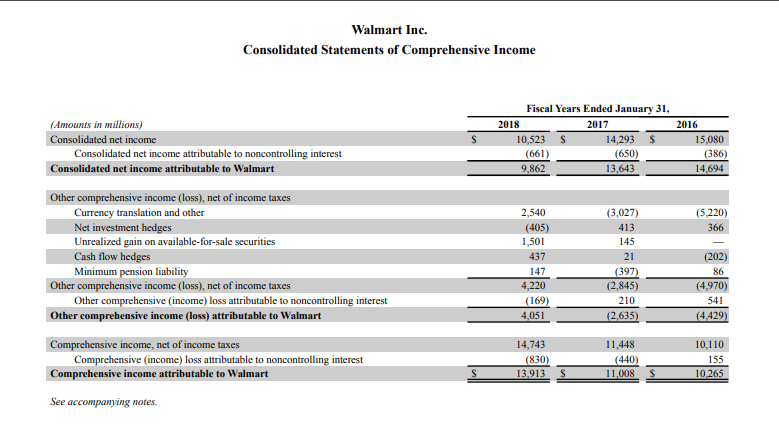
5. Net income (hint: look for Consolidated net income)
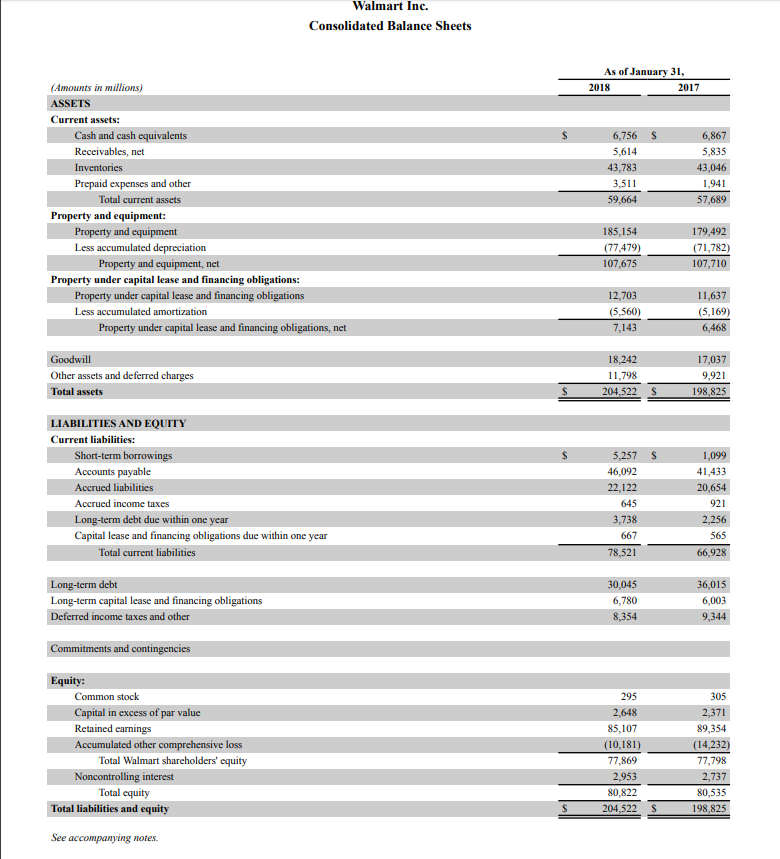
6. Total Assets
7. Total Current Assets
8. Total Cash & Cash Equivalents
9. Total Property & Equipment
10. Total Accumulated Depreciation
11. Total Liabilities
12.Total Current Liabilities
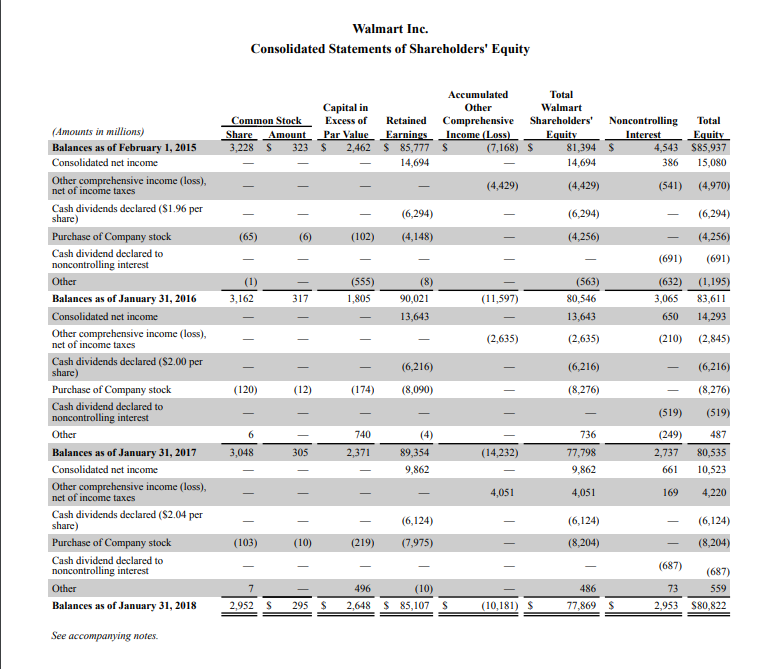
13. Total Equity
14. Total Common Stock
15. Total Retained Earnings
16. Net Income per share- basic
17. Does Walmart use lower of cost or market?
18. What inventory method is used by the Walmart U.S. segments?
19. On the balance sheet Receivables primarily of amounts from four items, list two of those items.
20. What amount of Property & Equipment is attributable to land?
21. What range of estimated useful lives does Walmart use to depreciation transportation equipment?
22. What method of depreciation does Walmart generally use?
23. What are Walmarts total accrued liabilities?
24. What are Walmarts accrued wages and benefits?
25. Walmart purchased Jet.com in September 2016, what was the purchase price? How was the lump purchase price allocated?
26. What amount was the fiscal 2019 annual dividends declared on February 20, 2018?
27. On what four dates will the 2019 dividends be paid?
28. What company conducted an audit of Walmart?
29. According to the 2018 Annual Report, how many Walmart Supercenters are in Oklahoma?
30. What is one thing you learned about Walmart by reading the annual report?
..
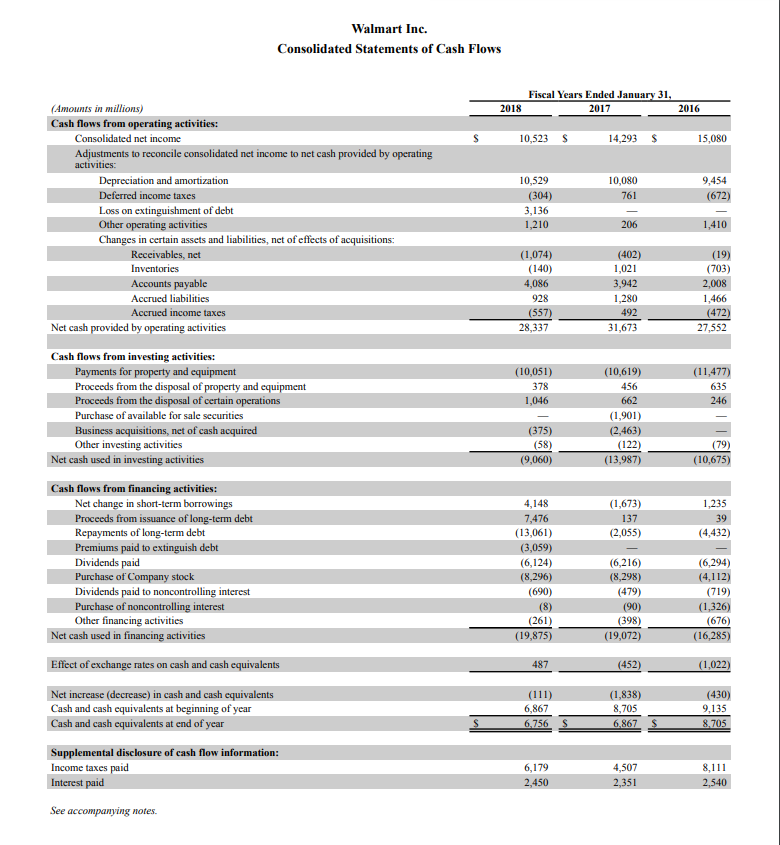
Walmart Inc. Consolidated Statements of Income Fiscal Years Ended January 31 (Amounts in millions, except per share data) 2018 2017 2016 495,761 S 481,317 S Net sales Membership and other income 4,582 500,343 4,556 485,873 478,614 ,516 482,130 Total revenues Costs and expenses: Cost of sales 373,396 106,510 20,437 361,256 101,853 22,764 360,984 97,041 24,105 Operating income Interest: 1,978 352 (152) 2,178 3,136 15,123 4,600 10,523 (661) Debt Capital lease and financing obligations Interest income 2,044 323 (100) 2,267 2,027 (81) 2,467 Interest, net Loss on extinguishment of debt Income before income taxes Provision for income taxes Consolidated net income Consolidated net income attributable to noncontrolling interest Consolidated net income attributable to Walmart 20,497 21,638 6,558 5,080 (386) 14,293 (650) 9,86 Net income per common share: 4.40 S 4.38 Basic net income per common share attributable to Walmart 3.29 S 4.58 Diluted net income per common share attributable to Walmart Weighted-average common shares outstanding: 3,101 112 Basic 2,995 3,207 Dividends declared per common share See accompanying notes. Walmart Inc. Consolidated Statements of Comprehensive Income Fiscal Years Ended January 31 Amounts in millions) 2018 2017 2016 net income 14,293 S 15,080 Consolidated net income attributable to noncontrolling interest (661) 9,862 (650) 13,643 Consolidated net income attributable to Walmart 14,694 Other comprehensive income (loss), net of income taxes 2,540 (405) 1,501 (3,027) 413 145 21 (397) (2,845) 210 635 (5,220) Currency translation and other Net investment hedges Unrealized gain on available-for-sale securities Cash flow hedges Minimum pension liability 147 4,220 (169) 4,051 86 4,970) 541 (4,429) Other comprehensive income (loss), net of income taxes comprehensive (income) loss attributable to ling interest Comprehensive income, net of income taxes Comprehensive income attributable to Walmart See accompanying notes. 11,448 (440 11,008 10,110 155 14,743 Comprehensive (income) loss attributable to noncontrolling interest (830) 13,913 S Walmart Inc. Consolidated Balance Sheets As of January 31 Amounts in millions) ASSETS Current assets: 2018 2017 Cash and cash equivalents Receivables, net 6,756 S 5,614 6,867 5,835 43,783 1,941 57,689 Prepaid expenses and other 3,511 ,664 Total current assets59 Property and equipment: 185,154 77,479) 107,675 79,492 (71,782) 107,710 Property and Property and equipment, net Property under capital lease and financing obligations: Property under capital lease and financing obligations (5,560) 7,143 11,637 (5,169) 6,468 Property under capital lease and financing obligations, net Goodwill Other assets and deferred charges Total assets 18,242 11,798 17,037 9,921 198,825 204,522 S LIABILITIES AND EQUITY Current liabilities: 5,257 S Accounts payable Accrued liabilities Accrued income taxes Long-term debt due within one year Capital lease and financing obligations due within one year 46,092 22,122 645 738 667 78,521 1,099 41,433 20,654 921 565 Total current liabilities 66,928 30,045 6,780 8,354 6,015 6,003 9,344 Long-term capital lease and financing obligations income taxes and other Equity: Common stock Capital in excess of par value Retained earnings Accumulated other comprehensive loss 295 305 85,107 (10,181) 77,869 2,953 80,822 89,354 Total Walmart shareholders' equity 77,798 737 80,535 198,825 Total equity Total liabilities and equity 204,522 S See accompanying notes. Walmart Inc. Consolidated Statements of Shareholders' Equity Total Walmart Accumulated Other Common Stock Excess of Retained Comprehensive Shareholders' Noncontrolling Total Income (Loss) Capital in Amounts in millions) Balances as of February 1, 2015 Consolidated net income Amount S Par Value S Earnings S 85,777 14,694 Interest Equity 4,543 S85,937 386 15,080 3,228 323 2,462 S (7,168) S 81,394 S 14,694 (4,429) (6,294) (4,256) income (loss) (4,429) (541) (4 net of income taxes Cash dividends declared ($1.96 per share) (6,294) (6,294) - Cash dividend declared to noncontrolling interest (691) (691) (632) (1,195) 3,065 83,611 650 14,293 (210) (2,845) (555) 1,805 (563) 80,546 13,643 (2,635) Balances as of January 31, 2016 3,162 90,021 (11,597) 13,643 Other comprehensive income (loss), (2,635) net of income taxes Cash dividends declared ($2.00 per share Purchase of Company stock Cash dividend declared to noncontrolling interest (6,216) (6,216) (6,216 (120) (12) (174) (8,090) (8,276) (8,276) - (519) (519) 740 (249) 2,371 89,354 9,862 2,737 80,535 Balances as of January 31, 2017 Consolidated net income 3,048 9,862 4,051 (6,124) (8,204) 661 10,523 169 4,220 (6,124) - (8,204) (687) (687) income (loss) 4,051 net of income taxes Cash dividends declared ($2.04 per (6,124) share) Purchase of Company stock Cash dividend declared to noncontrolling interest (219) 7,975) 486 73 559 Balances as of January 31, 2018 2,952 S 295 2,648 $ 85,107 S (10,181) $ 77,869 S 2,953 S80,822 See accompanying notes. Walmart Inc. Consolidated Statements of Cash Flows Fiscal Years Ended January 31 (Amounts in millions) Cash flows from operating activities: 2018 2017 2016 Consolidated net income 10,523 S 14,293 $ 15,080 Adjustments to reconcile consolidated net income to net cash provided by operating 10,080 Depreciation and amortization Deferred income taxes 10,529 9,454 (304) t of debt Other operating activities Changes in certain assets and liabilities, net of effects of acquisitions 1,074) (140) 4,086 928 (402) 1,021 Receivables, net (1 (703) 2,008 1,466 Accounts payable Accrued liabilities Accrued income taxes 492 31,673 Net cash provided by operating activities 28,337 27,552 Cash flows from investing activities: Payments for property and equipment Proceeds from the disposal of property and equipment Proceeds from the disposal of certain operations Purchase of available for sale securities Business acquisitions, net of cash acquired Other investing activities 456 662 (1,901) (2,463) (122) (13,987 635 246 58) (9,060) (79) (10,675) Net cash used in investing activities Cash flows from financing activities: Net change in short-term borrowings Proceeds from issuance of long-term debt Repayments of long-term debt Premiums paid to extinguish debt Dividends paid Purchase of Company stock Dividends paid to Purchase of noncontrolling interest Other financing activities (1,673) 39 (4,432) 7,476 (13,061) (3,059) (6,124) (8,296) (690) (2,055) (6,294) (6,216) (8,298) (479) noncontrolling interest (261) (19,875) (398) (19,072) (676) (16,285) Net cash used in financing activities Effect of exchange rates on cash and cash equivalents 487 Net increase (decrease) in cash and cash equivalents Cash and cash equivalents at beginning of year Cash and cash equivalents at end of year (430) (1,838) 8,705 6,867 6,867 Supplemental disclosure of cash flow information: Income taxes paid Interest paid 6,179 4,507 See accompanying notes


