Using a data set and this data dictionary I need question 4(.1 and .2) answered please.
I NEED THE CODE THAT WAS USED IN 4.2
The data set is below:
Here is the question I need answered using R please use R and just include the code:
 Thank You.
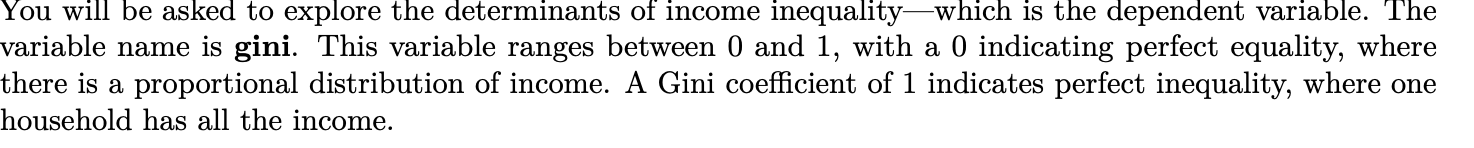
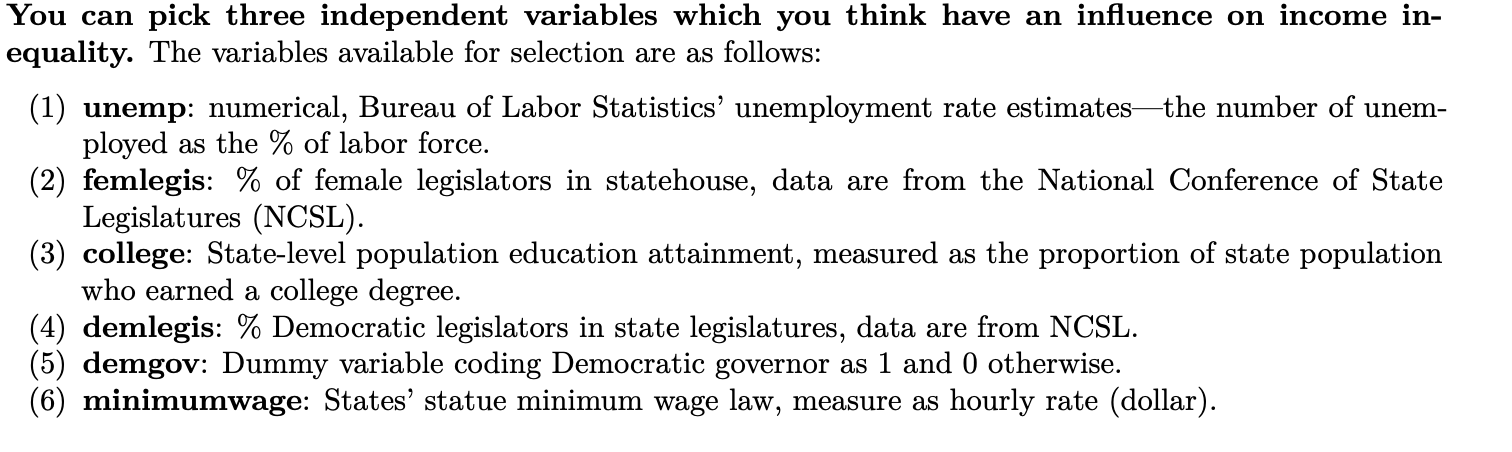
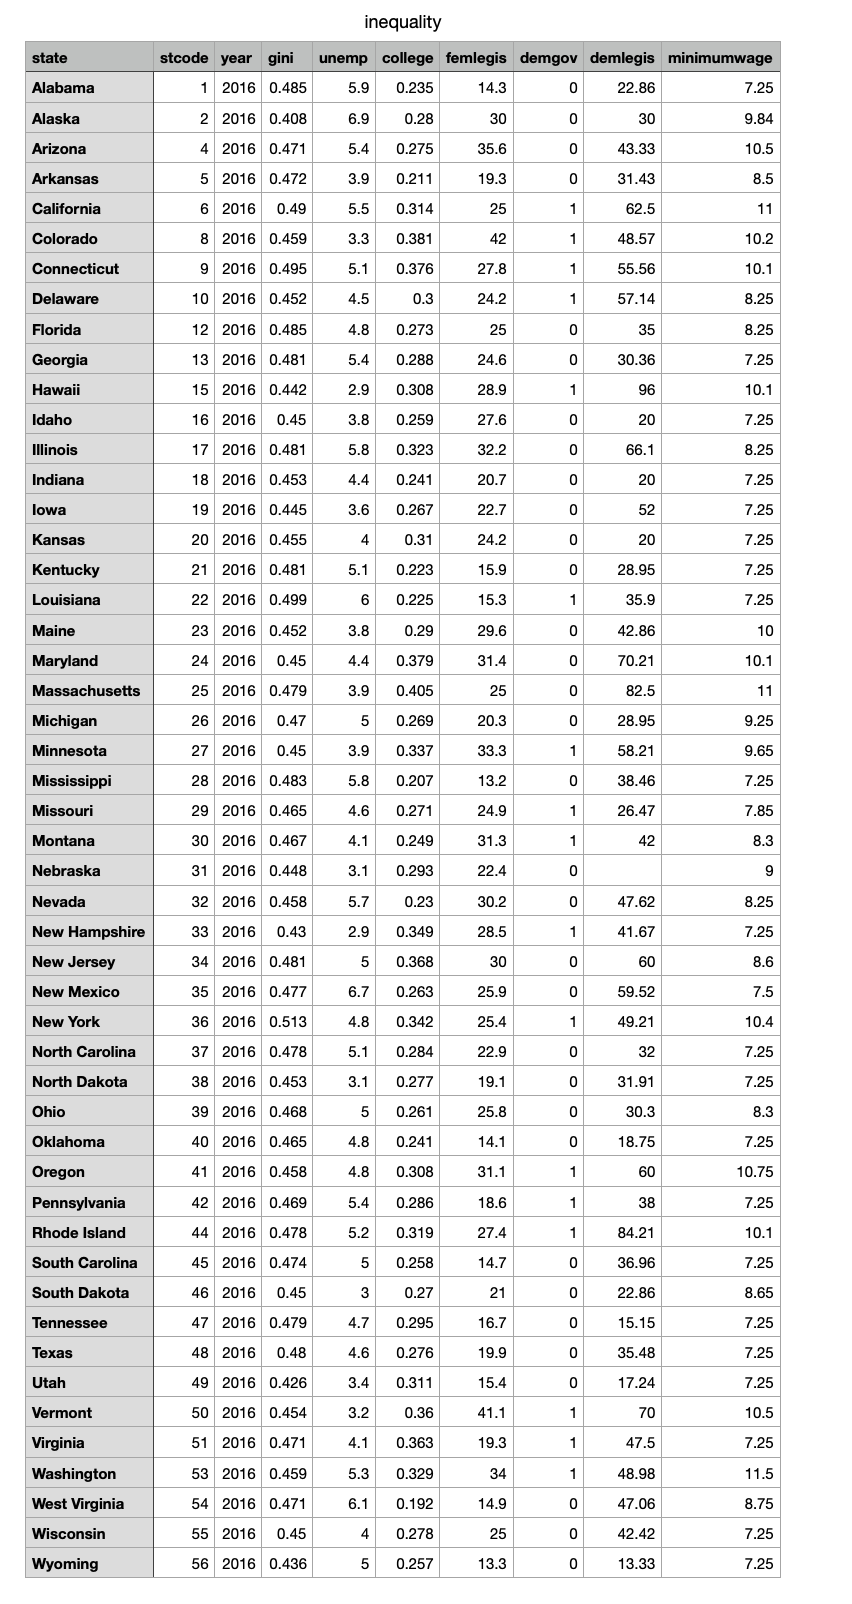
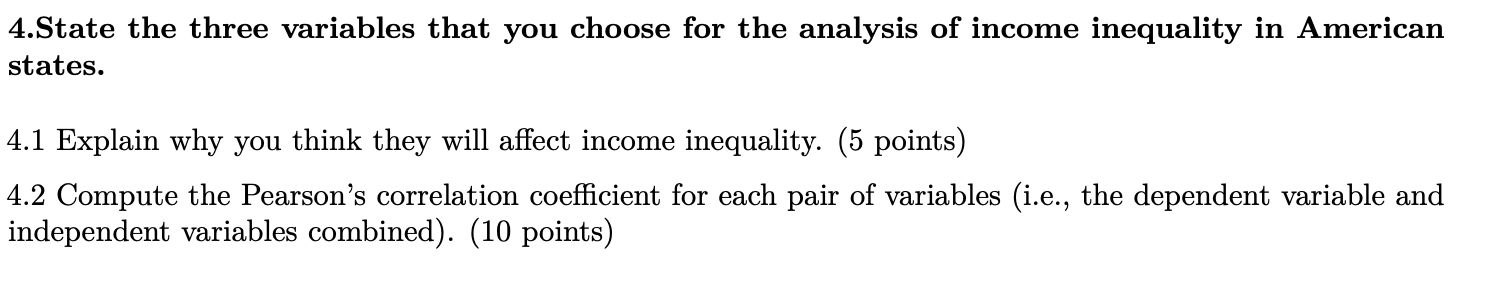
You will be asked to explore the determinants of income inequalitywhich is the dependent variable. The variable name is gini. This variable ranges between 0 and 1, with a 0 indicating perfect equality, where there is a proportional distribution of income. A Gini coefficient of 1 indicates perfect inequality, where one household has all the income. You can pick three independent variables which you think have an influence on income in- equality. The variables available for selection are as follows: (1) unemp: numerical, Bureau of Labor Statistics unemployment rate estimatesthe number of unem- ployed as the % of labor force. (2) femlegis: % of female legislators in statehouse, data are from the National Conference of State Legislatures (NCSL). (3) college: State-level population education attainment, measured as the proportion of state population who earned a college degree. (4) demlegis: % Democratic legislators in state legislatures, data are from NCSL. (5) demgov: Dummy variable coding Democratic governor as 1 and 0 otherwise. (6) minimumwage: States' statue minimum wage law, measure as hourly rate (dollar). inequality state stcode year gini unemp college femlegis demgov demlegis minimumwage Alabama 1 2016 0.485 5.9 0.235 14.3 . 0 22.86 7.25 Alaska 2 2016 0.408 6.9 0.28 30 0 30 9.84 Arizona 4 2016 0.471 5.4 0.275 35.6 0 43.33 10.5 Arkansas 5 2016 0.472 3.9 0.211 19.3 0 31.43 8.5 California 6 2016 0.49 5.5 0.314 25 1 62.5 11 Colorado 8 2016 0.459 3.3 0.381 42 1 48.57 10.2 Connecticut 9 2016 0.495 5.1 0.376 27.8 1 55.56 10.1 Delaware 10 2016 0.452 4.5 0.3 24.2 1 57.14 8.25 Florida 12 2016 0.485 4.8 0.273 25 0 35 8.25 Georgia 13 2016 0.481 5.4 0.288 24.6 0 30.36 7.25 Hawaii 15 2016 0.442 2.9 0.308 28.9 1 96 10.1 Idaho 16 2016 0.45 3.8 0.259 27.6 0 20 7.25 Illinois 17 2016 0.481 5.8 0.323 32.2 0 66.1 8.25 Indiana 18 2016 0.453 4.4 0.241 20.7 0 20 7.25 lowa 19 2016 0.445 3.6 0.267 22.7 0 52 7.25 Kansas 20 2016 0.455 4 0.31 24.2 0 20 7.25 Kentucky 21 2016 0.481 5.1 0.223 15.9 0 28.95 7.25 Louisiana 22 2016 0.499 6 0.225 15.3 1 35.9 7.25 Maine 23 2016 0.452 3.8 0.29 29.6 0 42.86 10 Maryland 24 2016 0.45 4.4 0.379 31.4 0 70.21 10.1 Massachusetts 25 2016 0.479 3.9 0.405 25 0 82.5 11 Michigan 26 2016 0.47 5 0.269 20.3 0 28.95 9.25 Minnesota 27 2016 0.45 3.9 0.337 33.3 1 58.21 9.65 Mississippi 28 2016 0.483 5.8 0.207 13.2 38.46 7.25 Missouri 29 2016 0.465 4.6 0.271 24.9 1 26.47 7.85 Montana 30 2016 0.467 4.1 0.249 31.3 1 42 8.3 Nebraska 31 2016 0.448 3.1 0.293 22.4 o 0 9 Nevada 32 2016 0.458 5.7 0.23 30.2 0 47.62 8.25 New Hampshire 33 2016 0.43 2.9 0.349 28.5 1 41.67 7.25 New Jersey 34 2016 0.481 5 0.368 30 0 60 8.6 New Mexico 35 2016 0.477 6.7 0.263 25.9 0 59.52 7.5 New York 36 2016 0.513 4.8 0.342 25.4 1 49.21 10.4 North Carolina 37 2016 0.478 5.1 0.284 22.9 0 32 7.25 North Dakota 38 2016 0.453 3.1 0.277 19.1 o od 31.91 7.25 Ohio 39 2016 0.468 5 0.261 25.8 0 30.3 8.3 Oklahoma 40 2016 0.465 4.8 0.241 14.1 0 18.75 7.25 Oregon 41 2016 0.458 4.8 0.308 31.1 1 60 10.75 Pennsylvania 42 2016 0.469 5.4 0.286 18.6 1 38 7.25 Rhode Island 44 2016 0.478 5.2 0.319 27.4 1 84.21 10.1 South Carolina 45 2016 0.474 5 0.258 14.7 0 36.96 7.25 South Dakota 46 2016 0.45 3 0.27 21 0 22.86 8.65 Tennessee 47 2016 0.479 4.7 0.295 16.7 0 15.15 7.25 Texas 48 2016 0.48 4.6 0.276 19.9 0 35.48 7.25 Utah 49 2016 0.426 3.4 0.311 15.4 0 17.24 7.25 Vermont 50 2016 0.454 3.2 0.36 41.1 1 70 10.5 Virginia 51 2016 0.471 4.1 0.363 19.3 1 47.5 7.25 Washington 53 2016 0.459 5.3 0.329 34 1 48.98 11.5 West Virginia 54 2016 0.471 6.1 0.192 14.9 47.06 8.75 Wisconsin 55 2016 0.45 4 0.278 25 ooo 42.42 7.25 Wyoming 56 2016 0.436 5 0.257 13.3 13.33 7.25 4.State the three variables that you choose for the analysis of income inequality in American states. 4.1 Explain why you think they will affect income inequality. (5 points) 4.2 Compute the Pearson's correlation coefficient for each pair of variables (i.e., the dependent variable and independent variables combined). (10 points) You will be asked to explore the determinants of income inequalitywhich is the dependent variable. The variable name is gini. This variable ranges between 0 and 1, with a 0 indicating perfect equality, where there is a proportional distribution of income. A Gini coefficient of 1 indicates perfect inequality, where one household has all the income. You can pick three independent variables which you think have an influence on income in- equality. The variables available for selection are as follows: (1) unemp: numerical, Bureau of Labor Statistics unemployment rate estimatesthe number of unem- ployed as the % of labor force. (2) femlegis: % of female legislators in statehouse, data are from the National Conference of State Legislatures (NCSL). (3) college: State-level population education attainment, measured as the proportion of state population who earned a college degree. (4) demlegis: % Democratic legislators in state legislatures, data are from NCSL. (5) demgov: Dummy variable coding Democratic governor as 1 and 0 otherwise. (6) minimumwage: States' statue minimum wage law, measure as hourly rate (dollar). inequality state stcode year gini unemp college femlegis demgov demlegis minimumwage Alabama 1 2016 0.485 5.9 0.235 14.3 . 0 22.86 7.25 Alaska 2 2016 0.408 6.9 0.28 30 0 30 9.84 Arizona 4 2016 0.471 5.4 0.275 35.6 0 43.33 10.5 Arkansas 5 2016 0.472 3.9 0.211 19.3 0 31.43 8.5 California 6 2016 0.49 5.5 0.314 25 1 62.5 11 Colorado 8 2016 0.459 3.3 0.381 42 1 48.57 10.2 Connecticut 9 2016 0.495 5.1 0.376 27.8 1 55.56 10.1 Delaware 10 2016 0.452 4.5 0.3 24.2 1 57.14 8.25 Florida 12 2016 0.485 4.8 0.273 25 0 35 8.25 Georgia 13 2016 0.481 5.4 0.288 24.6 0 30.36 7.25 Hawaii 15 2016 0.442 2.9 0.308 28.9 1 96 10.1 Idaho 16 2016 0.45 3.8 0.259 27.6 0 20 7.25 Illinois 17 2016 0.481 5.8 0.323 32.2 0 66.1 8.25 Indiana 18 2016 0.453 4.4 0.241 20.7 0 20 7.25 lowa 19 2016 0.445 3.6 0.267 22.7 0 52 7.25 Kansas 20 2016 0.455 4 0.31 24.2 0 20 7.25 Kentucky 21 2016 0.481 5.1 0.223 15.9 0 28.95 7.25 Louisiana 22 2016 0.499 6 0.225 15.3 1 35.9 7.25 Maine 23 2016 0.452 3.8 0.29 29.6 0 42.86 10 Maryland 24 2016 0.45 4.4 0.379 31.4 0 70.21 10.1 Massachusetts 25 2016 0.479 3.9 0.405 25 0 82.5 11 Michigan 26 2016 0.47 5 0.269 20.3 0 28.95 9.25 Minnesota 27 2016 0.45 3.9 0.337 33.3 1 58.21 9.65 Mississippi 28 2016 0.483 5.8 0.207 13.2 38.46 7.25 Missouri 29 2016 0.465 4.6 0.271 24.9 1 26.47 7.85 Montana 30 2016 0.467 4.1 0.249 31.3 1 42 8.3 Nebraska 31 2016 0.448 3.1 0.293 22.4 o 0 9 Nevada 32 2016 0.458 5.7 0.23 30.2 0 47.62 8.25 New Hampshire 33 2016 0.43 2.9 0.349 28.5 1 41.67 7.25 New Jersey 34 2016 0.481 5 0.368 30 0 60 8.6 New Mexico 35 2016 0.477 6.7 0.263 25.9 0 59.52 7.5 New York 36 2016 0.513 4.8 0.342 25.4 1 49.21 10.4 North Carolina 37 2016 0.478 5.1 0.284 22.9 0 32 7.25 North Dakota 38 2016 0.453 3.1 0.277 19.1 o od 31.91 7.25 Ohio 39 2016 0.468 5 0.261 25.8 0 30.3 8.3 Oklahoma 40 2016 0.465 4.8 0.241 14.1 0 18.75 7.25 Oregon 41 2016 0.458 4.8 0.308 31.1 1 60 10.75 Pennsylvania 42 2016 0.469 5.4 0.286 18.6 1 38 7.25 Rhode Island 44 2016 0.478 5.2 0.319 27.4 1 84.21 10.1 South Carolina 45 2016 0.474 5 0.258 14.7 0 36.96 7.25 South Dakota 46 2016 0.45 3 0.27 21 0 22.86 8.65 Tennessee 47 2016 0.479 4.7 0.295 16.7 0 15.15 7.25 Texas 48 2016 0.48 4.6 0.276 19.9 0 35.48 7.25 Utah 49 2016 0.426 3.4 0.311 15.4 0 17.24 7.25 Vermont 50 2016 0.454 3.2 0.36 41.1 1 70 10.5 Virginia 51 2016 0.471 4.1 0.363 19.3 1 47.5 7.25 Washington 53 2016 0.459 5.3 0.329 34 1 48.98 11.5 West Virginia 54 2016 0.471 6.1 0.192 14.9 47.06 8.75 Wisconsin 55 2016 0.45 4 0.278 25 ooo 42.42 7.25 Wyoming 56 2016 0.436 5 0.257 13.3 13.33 7.25 4.State the three variables that you choose for the analysis of income inequality in American states. 4.1 Explain why you think they will affect income inequality. (5 points) 4.2 Compute the Pearson's correlation coefficient for each pair of variables (i.e., the dependent variable and independent variables combined). (10 points)