Using a VC model and assumptions of a venture capital return of 45%. Given the results of your model, estimate the share of equity PW would need to give in exchange for raising $950,000 from VC investors. Based on your analysis of the balance sheet, income statement, and cash flow statement, assess the need for the $950,000 and offer an opinion as to whether it is even necessary at this time.


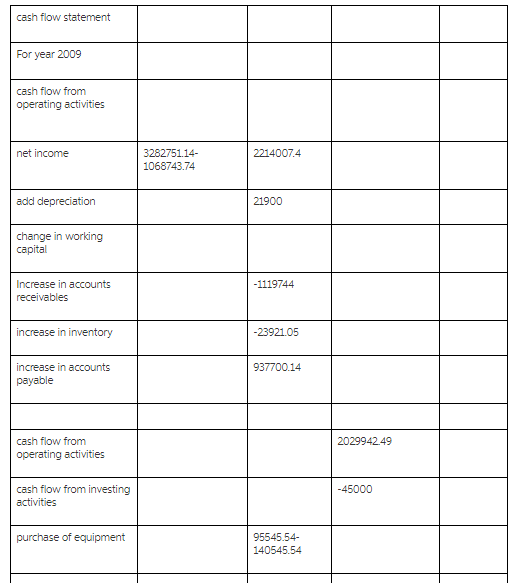
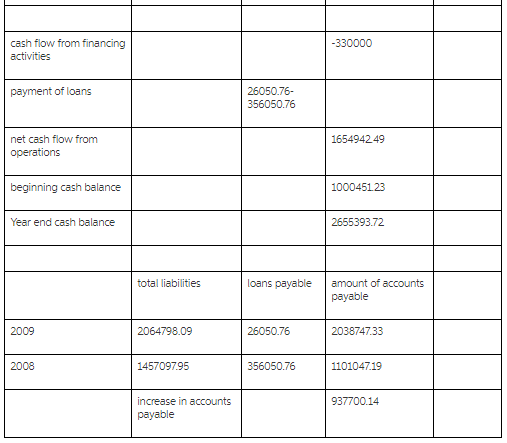
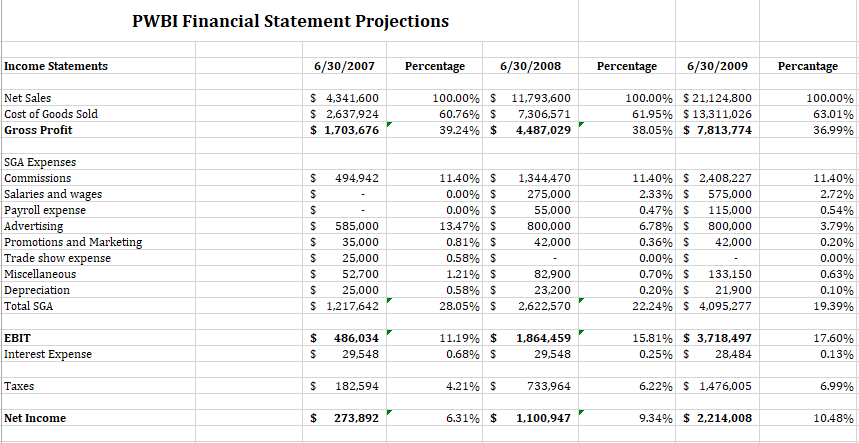
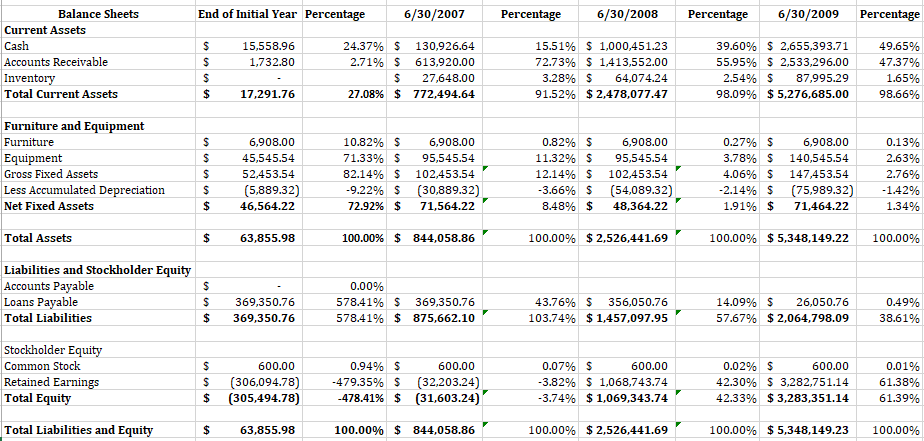
cash flow statement For year 2009 cash flow from operating activities net income 3282751.14- 1068743.74 2214007.4 add depreciation 21900 change in working capital Increase in accounts receivables 1119744 increase in inventory 23921.05 increase in accounts payable 937700.14 cash flow from operating activities 202994249 cash flow from investino 45000 purchase of equipment 95545.54- 140545.54 activitieS payment of loans 26050.76- net cash flow from operations 1654942 49 beginning cash balance 100045123 Year end cash balance total liabilities loans payable amount of accounts payable 26050.76 2038747.33 1457097.95 110104719 increase in accounts payable 937700.14 PWBI Financial Statement Projections Income Statements 6/30/2007 Percentage 6/30/2008 Percentage 6/30/2009 Percantage Net Sales Cost of Goods Sold Gross Profit S 4,341,600 S 2,637,924 s 1,703,676 100.00% $ 11,793,600 60.76%$ 7,306,571 39.24% $ 4,487,029, 100.00% $21,124,800 61.95% $13,311,026 38.05% $ 7,813,774 100.00% 63.01% 36.99% SGA Expenses Commissions Salaries and wages Payroll expense Advertising Promotions and Marketing Trade show expense Miscellaneous Depreciation Total SGA S 494,942 S 585,000 S 35,000 S 25,000 S 52,700 S 25,000 s 1,217,642 11.40%$ 1,344,470 275,000 55,000 800,000 42,000 0.00% s 0.00% s 13.47% $ 0.81% $ 0.58% s 1.21% s 0.58% s 11.40% $ 2,408,227 2.33%$ 575,000 0.47% $ 115,000 6.78% $ 800,000 0.36%$ 42,000 11.40% 2.72% 0.54% 3.79% 0.20% 0.00% 0.63% 0.10% 19.39% 0.00% s 82,900 23,200 0.70% $ 133,150 0.20%$ 21,900 22.24% $ 4,095,277 28.05%$ 2,622,570. s 486,034 11.19% $ 1,864,459, EBIT Interest Expense 15.81% $ 3,718,497 0.25%$ 28,484 17.60% 0.13% S 29,548 S 182,594 s 273,892 0.68% $ 4.21% $ 6.31% $ 1,100,947 29,548 Taxes 733,964 6.22% $ 1,476,005 6.99% Net Income 9.34% $ 2,214,008 10.48% Balance Sheets End of Initial Year Percentage 6/30/2007 Percentage 6/30/2008 Percentage 6/30/2009 Percentage Current Assets 15,558.96 1,732.80 Accounts Receivable Inventory Total Current Assets 24.37% $ 130,926.64 2.71% $ 613,920.00 $ 27,648.00 27.08% $ 772,494.64 15.51% $ 1,000,451.23 72.73% $ 1,413,552.00 3.28% $ 64,074.24 91.52% $2,478,077.47 39.60% $ 2,655,393.71 55.95%$2,533,296.00 2.54%$ 87,995.29 98.09% $5,276,685.00 49.65% 47.37% 1.65% 98.66% 17,291.76 Furniture and Equipment Furniture Equipment Gross Fixed Assets Less Accumulated Depreciation Net Fixed Assets 6,908.00 45,545.54 52,453.54 (5,889.32) 46,564.22 10.82%$ 6,908.00 71.33%$ 95,545.54 82.14% $ 102,453.54. 9.22% $ (30,889.32) 72.92% $ 71,564.22, 6,908.00 11.32%$ 95,545.54 0.82%$ 12.14% $ 102,453.54. 3.66% $ (54,089.32) 8.48% $ 48,364.22, 0.27%$ 6,908.00 3.78% $ 140,545.54 4.06% $ 147,453.54 (75,989.32) 1.91% $ 71,464.22 0.13% 2.63% 2.76% -1.42% 1.34% 2.14% $ $ Total Assets S63,855.98 100.00% $ 844,058.86 . 100.00% $2,526,441.69 . 100.00% $5,348,149.22 100.00% Liabilities and Stockholder Equitv Accounts Pavable Loans Payable 0.00% 578.4196 $ 369,350.76 578.41% $ 875,662.10 . S 369,350.76 $ 369,350.76 43.76% $ 356,050.76 103.74% $1,457,097.95 . 14.09% $ 26,050.76 57.67% $2,064,798.09 0.49% 38.61% Total Liabilities Stockholder Equi Common Stock Retained Earnings Total Equity 600.00 (306,094.78) (305,494.78) 0.94% $ $ $ 600.00 (32,203.24) (31,603.24) 0.07% s 3.82% $ 1,068,743.74 3.74% $1,069,343.74. 0.01% 61.38% 61.39% 600.00 600.00 42.30% $3,282,751.14 42.33% $3,283,351.14 0.02% $ $ $ -479.35% -478.41% Total Liabilities and Equity S63,855.98 100.00% $ 844,058.86 . 100.00% $2,526,441.69 . 100.00% $5,348,149.23 100.00% cash flow statement For year 2009 cash flow from operating activities net income 3282751.14- 1068743.74 2214007.4 add depreciation 21900 change in working capital Increase in accounts receivables 1119744 increase in inventory 23921.05 increase in accounts payable 937700.14 cash flow from operating activities 202994249 cash flow from investino 45000 purchase of equipment 95545.54- 140545.54 activitieS payment of loans 26050.76- net cash flow from operations 1654942 49 beginning cash balance 100045123 Year end cash balance total liabilities loans payable amount of accounts payable 26050.76 2038747.33 1457097.95 110104719 increase in accounts payable 937700.14 PWBI Financial Statement Projections Income Statements 6/30/2007 Percentage 6/30/2008 Percentage 6/30/2009 Percantage Net Sales Cost of Goods Sold Gross Profit S 4,341,600 S 2,637,924 s 1,703,676 100.00% $ 11,793,600 60.76%$ 7,306,571 39.24% $ 4,487,029, 100.00% $21,124,800 61.95% $13,311,026 38.05% $ 7,813,774 100.00% 63.01% 36.99% SGA Expenses Commissions Salaries and wages Payroll expense Advertising Promotions and Marketing Trade show expense Miscellaneous Depreciation Total SGA S 494,942 S 585,000 S 35,000 S 25,000 S 52,700 S 25,000 s 1,217,642 11.40%$ 1,344,470 275,000 55,000 800,000 42,000 0.00% s 0.00% s 13.47% $ 0.81% $ 0.58% s 1.21% s 0.58% s 11.40% $ 2,408,227 2.33%$ 575,000 0.47% $ 115,000 6.78% $ 800,000 0.36%$ 42,000 11.40% 2.72% 0.54% 3.79% 0.20% 0.00% 0.63% 0.10% 19.39% 0.00% s 82,900 23,200 0.70% $ 133,150 0.20%$ 21,900 22.24% $ 4,095,277 28.05%$ 2,622,570. s 486,034 11.19% $ 1,864,459, EBIT Interest Expense 15.81% $ 3,718,497 0.25%$ 28,484 17.60% 0.13% S 29,548 S 182,594 s 273,892 0.68% $ 4.21% $ 6.31% $ 1,100,947 29,548 Taxes 733,964 6.22% $ 1,476,005 6.99% Net Income 9.34% $ 2,214,008 10.48% Balance Sheets End of Initial Year Percentage 6/30/2007 Percentage 6/30/2008 Percentage 6/30/2009 Percentage Current Assets 15,558.96 1,732.80 Accounts Receivable Inventory Total Current Assets 24.37% $ 130,926.64 2.71% $ 613,920.00 $ 27,648.00 27.08% $ 772,494.64 15.51% $ 1,000,451.23 72.73% $ 1,413,552.00 3.28% $ 64,074.24 91.52% $2,478,077.47 39.60% $ 2,655,393.71 55.95%$2,533,296.00 2.54%$ 87,995.29 98.09% $5,276,685.00 49.65% 47.37% 1.65% 98.66% 17,291.76 Furniture and Equipment Furniture Equipment Gross Fixed Assets Less Accumulated Depreciation Net Fixed Assets 6,908.00 45,545.54 52,453.54 (5,889.32) 46,564.22 10.82%$ 6,908.00 71.33%$ 95,545.54 82.14% $ 102,453.54. 9.22% $ (30,889.32) 72.92% $ 71,564.22, 6,908.00 11.32%$ 95,545.54 0.82%$ 12.14% $ 102,453.54. 3.66% $ (54,089.32) 8.48% $ 48,364.22, 0.27%$ 6,908.00 3.78% $ 140,545.54 4.06% $ 147,453.54 (75,989.32) 1.91% $ 71,464.22 0.13% 2.63% 2.76% -1.42% 1.34% 2.14% $ $ Total Assets S63,855.98 100.00% $ 844,058.86 . 100.00% $2,526,441.69 . 100.00% $5,348,149.22 100.00% Liabilities and Stockholder Equitv Accounts Pavable Loans Payable 0.00% 578.4196 $ 369,350.76 578.41% $ 875,662.10 . S 369,350.76 $ 369,350.76 43.76% $ 356,050.76 103.74% $1,457,097.95 . 14.09% $ 26,050.76 57.67% $2,064,798.09 0.49% 38.61% Total Liabilities Stockholder Equi Common Stock Retained Earnings Total Equity 600.00 (306,094.78) (305,494.78) 0.94% $ $ $ 600.00 (32,203.24) (31,603.24) 0.07% s 3.82% $ 1,068,743.74 3.74% $1,069,343.74. 0.01% 61.38% 61.39% 600.00 600.00 42.30% $3,282,751.14 42.33% $3,283,351.14 0.02% $ $ $ -479.35% -478.41% Total Liabilities and Equity S63,855.98 100.00% $ 844,058.86 . 100.00% $2,526,441.69 . 100.00% $5,348,149.23 100.00%


