Answered step by step
Verified Expert Solution
Question
1 Approved Answer
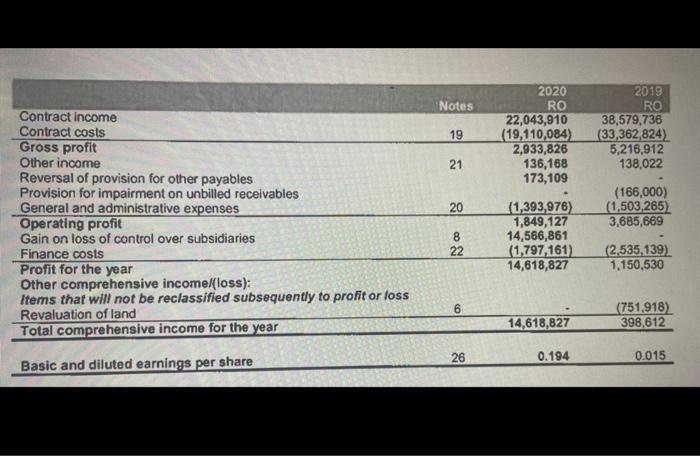
Using CVP analysis build a graph based on the latest income statement. Calculate the following figures for two years based on the income statement:


Using CVP analysis build a graph based on the latest income statement. Calculate the following figures for two years based on the income statement: (4 points) Contribution Margin Ratio Level of sales needed to achieve a desired target profit (for example, if the company wants to increase profits by 10%) Break-even point Margin of safety Explain the meaning of each indicator and describe their dynamics over two years. You must choose one of the companies on the website https://www.msx.om/ and inform the teacher about your choice (Appendix 1) Contract income Contract costs Gross profit Other income Reversal of provision for other payables Provision for impairment on unbilled receivables General and administrative expenses Operating profit Gain on loss of control over subsidiaries Finance costs Profit for the year Other comprehensive income/(loss): Items that will not be reclassified subsequently to profit or loss Revaluation of land Total comprehensive income for the year Basic and diluted earnings per share Notes 19 21 2 82 20 22 6 26 2020 RO 22,043,910 (19,110,084) 2,933,826 136,168 173,109 (1,393,976) 1,849,127 14,566,861 (1,797,161) 14,618,827 14,618,827 0.194 2019 RO 38,579,736 (33,362,824) 5,216,912 138,022 (166,000) (1,503,265) 3,685,669 (2,535,139) 1,150,530 (751.918) 398,612 0.015
Step by Step Solution
★★★★★
3.57 Rating (150 Votes )
There are 3 Steps involved in it
Step: 1
I have chosen Gulf Cable Industries Company SAOG Gulf Cable for this analysis based on its financial ...
Get Instant Access to Expert-Tailored Solutions
See step-by-step solutions with expert insights and AI powered tools for academic success
Step: 2

Step: 3

Ace Your Homework with AI
Get the answers you need in no time with our AI-driven, step-by-step assistance
Get Started


