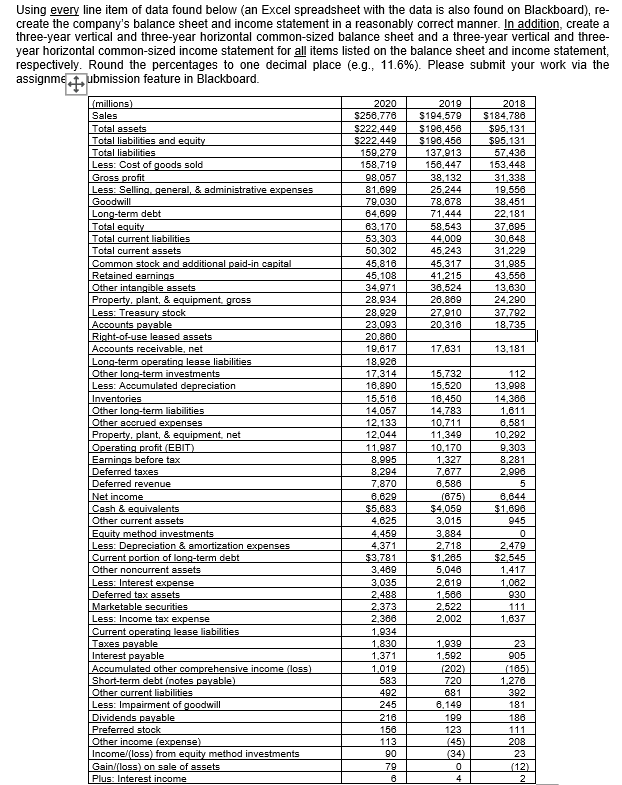
Using every line item of data found below (an Excel spreadsheet with the data is also found on Blackboard), re- create the company's balance sheet and income statement in a reasonably correct manner. In addition, create a three-year vertical and three-year horizontal common-sized balance sheet and a three-year vertical and three- year horizontal common-sized income statement for all items listed on the balance sheet and income statement, respectively. Round the percentages to one decimal place (e.g., 11.6%). Please submit your work via the assignmeubmission feature in Blackboard. millions) 2020 2019 2018 Sales $256,776 $194,579 $184,786 Total assets $222.449 $196,456 $95.131 Total liabilities and equity $222.449 $196,456 $95,131 Total liabilities 159.279 137,913 57,436 Less: Cost of goods sold 158,719 156,447 153,448 Gross profit 98.057 38,132 31,338 Less: Selling general, & administrative expenses 81,699 25,244 19.550 Goodwill 79.030 78.678 38,451 Long-term debt 84,699 71,444 22,181 Total equity 63,170 58,543 37.695 Total current liabilities 53,303 44,009 30.848 Total current assets 50,302 45,243 31,229 Common stock and additional paid-in capital 45.816 45,317 31,985 Retained earnings 45,108 41,215 43,556 Other intangible assets 34.971 38,524 13,630 Property, plant, & equipment, gross 28,934 26,869 24,290 Less: Treasury stock 28.920 27.910 37.792 Accounts payable 23.093 20,316 18,735 Right-of-use leased assets 20.860 Accounts receivable, net 19,617 17,631 13,181 Long-term operating lease liabilities 18.926 Other long-term investments 17.314 15.732 112 Less: Accumulated depreciation 16.890 15.520 13.998 Inventories 15,516 16.450 14,366 Other long-term liabilities 14.057 14,783 1.611 Other accrued expenses 12.133 10.711 6.581 Property, plant, & equipment, net 12.044 11.349 10.292 Operating profit (EBIT) 11,987 10.170 9,303 Earnings before tax 8.995 1.327 8.281 Deferred taxes 8,294 7677 2.990 Deferred revenue 7.870 6.586 5 Net income 8,629 (675) 6.644 Cash & equivalents $5.683 $4,050 $1.698 Other current assets 4,625 3.015 945 Equity method investments 4,459 3.884 0 Less: Depreciation & amortization expenses 4,371 2.718 2,479 Current portion of long-term debt $3,781 $1.265 $2.545 Other noncurrent assets 3.489 5,048 1,417 Less: Interest expense 3.035 2.619 1.002 Deferred tax assets 2.488 1,566 930 Marketable secunties 2.373 2.522 111 Less: Income tax expense 2.366 2.002 1.637 Current operating lease liabilities 1.934 Taxes payable 1.830 1.939 23 Interest payable 1.371 1.592 905 Accumulated other comprehensive income (loss) 1,019 (202) (165) Short-term debt (notes payable) 583 720 1.270 Other current liabilities 492 681 392 Less: Impairment of goodwill 245 8.149 181 Dividends payable 216 199 186 Preferred stock 156 123 111 Other income expense) 113 208 Income (loss) from equity method investments 90 (34) 23 Gain/(loss) on sale of assets 79 0 (12) Plus: Interest income 6 4 2 (45) Using every line item of data found below (an Excel spreadsheet with the data is also found on Blackboard), re- create the company's balance sheet and income statement in a reasonably correct manner. In addition, create a three-year vertical and three-year horizontal common-sized balance sheet and a three-year vertical and three- year horizontal common-sized income statement for all items listed on the balance sheet and income statement, respectively. Round the percentages to one decimal place (e.g., 11.6%). Please submit your work via the assignmeubmission feature in Blackboard. millions) 2020 2019 2018 Sales $256,776 $194,579 $184,786 Total assets $222.449 $196,456 $95.131 Total liabilities and equity $222.449 $196,456 $95,131 Total liabilities 159.279 137,913 57,436 Less: Cost of goods sold 158,719 156,447 153,448 Gross profit 98.057 38,132 31,338 Less: Selling general, & administrative expenses 81,699 25,244 19.550 Goodwill 79.030 78.678 38,451 Long-term debt 84,699 71,444 22,181 Total equity 63,170 58,543 37.695 Total current liabilities 53,303 44,009 30.848 Total current assets 50,302 45,243 31,229 Common stock and additional paid-in capital 45.816 45,317 31,985 Retained earnings 45,108 41,215 43,556 Other intangible assets 34.971 38,524 13,630 Property, plant, & equipment, gross 28,934 26,869 24,290 Less: Treasury stock 28.920 27.910 37.792 Accounts payable 23.093 20,316 18,735 Right-of-use leased assets 20.860 Accounts receivable, net 19,617 17,631 13,181 Long-term operating lease liabilities 18.926 Other long-term investments 17.314 15.732 112 Less: Accumulated depreciation 16.890 15.520 13.998 Inventories 15,516 16.450 14,366 Other long-term liabilities 14.057 14,783 1.611 Other accrued expenses 12.133 10.711 6.581 Property, plant, & equipment, net 12.044 11.349 10.292 Operating profit (EBIT) 11,987 10.170 9,303 Earnings before tax 8.995 1.327 8.281 Deferred taxes 8,294 7677 2.990 Deferred revenue 7.870 6.586 5 Net income 8,629 (675) 6.644 Cash & equivalents $5.683 $4,050 $1.698 Other current assets 4,625 3.015 945 Equity method investments 4,459 3.884 0 Less: Depreciation & amortization expenses 4,371 2.718 2,479 Current portion of long-term debt $3,781 $1.265 $2.545 Other noncurrent assets 3.489 5,048 1,417 Less: Interest expense 3.035 2.619 1.002 Deferred tax assets 2.488 1,566 930 Marketable secunties 2.373 2.522 111 Less: Income tax expense 2.366 2.002 1.637 Current operating lease liabilities 1.934 Taxes payable 1.830 1.939 23 Interest payable 1.371 1.592 905 Accumulated other comprehensive income (loss) 1,019 (202) (165) Short-term debt (notes payable) 583 720 1.270 Other current liabilities 492 681 392 Less: Impairment of goodwill 245 8.149 181 Dividends payable 216 199 186 Preferred stock 156 123 111 Other income expense) 113 208 Income (loss) from equity method investments 90 (34) 23 Gain/(loss) on sale of assets 79 0 (12) Plus: Interest income 6 4 2 (45)