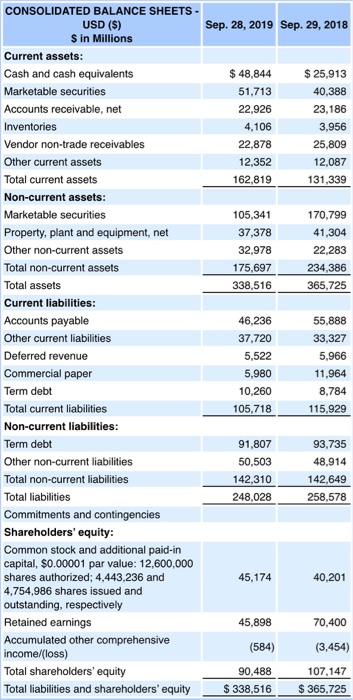
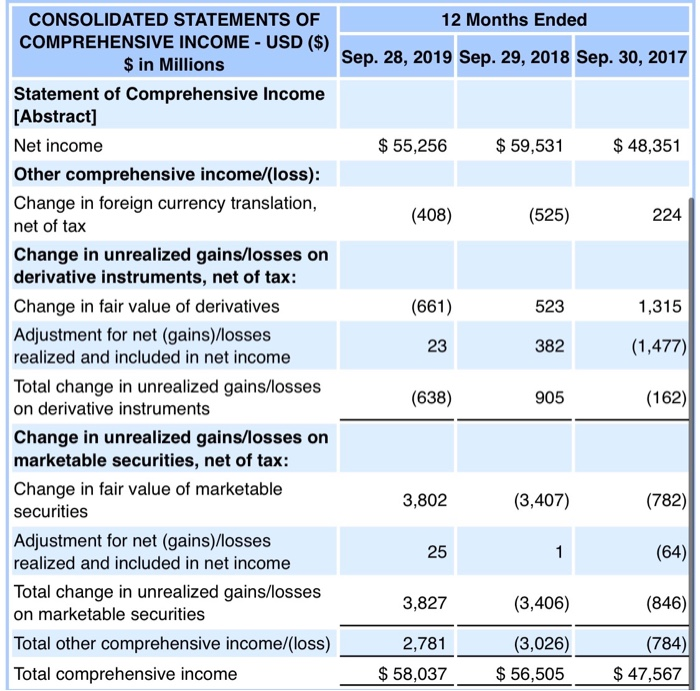
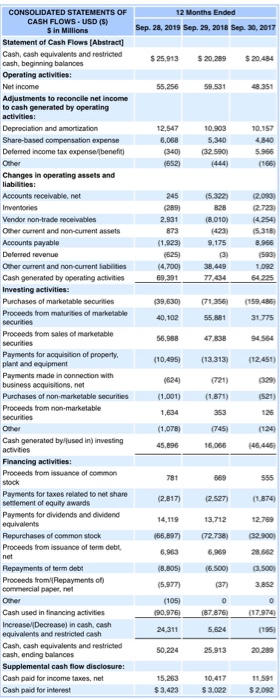
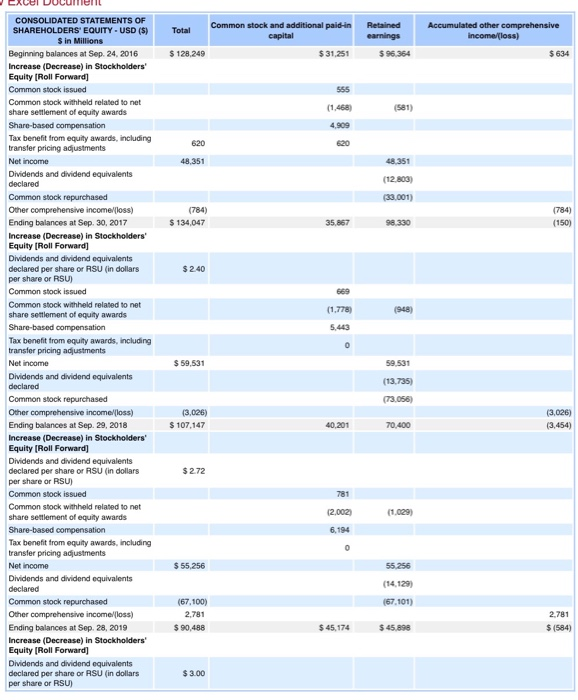
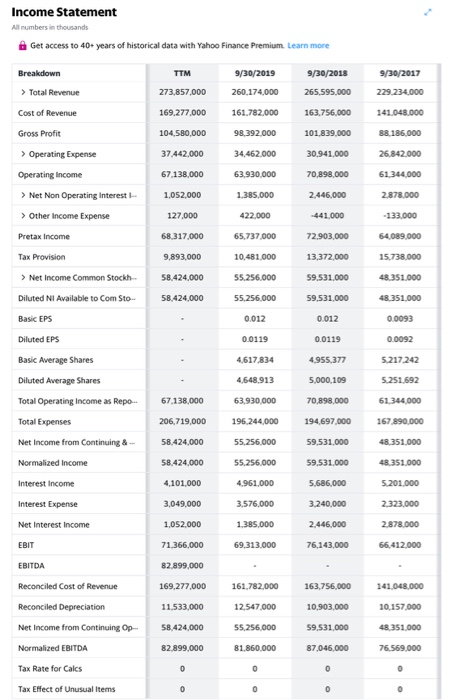
Using Excel calculate the following for Apple's current year: a. Earnings Per Share. b. Working Capital. C. Current Ratio. d. Quick Ratio. e. Receivables Turnover. f. Inventory Turnover. g. Profit Magin Ratio. h. Gross Profit Margin. I. Return on assets. j. Return on common stockholders' equity. k. Payout Ratio. I. Free cash flow. Sep. 28, 2019 Sep. 29, 2018 $ 48,844 51,713 22,926 4,106 22,878 12,352 162,819 $ 25,913 40,388 23,186 3,956 25,809 12,087 131,339 105,341 37,378 32,978 175,697 338,516 170,799 41,304 22,283 234,386 365,725 CONSOLIDATED BALANCE SHEETS USD ($) $ in Millions Current assets: Cash and cash equivalents Marketable securities Accounts receivable, net Inventories Vendor non-trade receivables Other current assets Total current assets Non-current assets: Marketable securities Property, plant and equipment, net Other non-current assets Total non-current assets Total assets Current liabilities: Accounts payable Other current liabilities Deferred revenue Commercial paper Term debt Total current liabilities Non-current liabilities: Term debt Other non-current liabilities Total non-current liabilities Total liabilities Commitments and contingencies Shareholders' equity: Common stock and additional paid-in capital, $0.00001 par value: 12,600,000 shares authorized; 4,443,236 and 4,754,986 shares issued and outstanding, respectively Retained earnings Accumulated other comprehensive income/(loss) Total shareholders' equity Total liabilities and shareholders' equity 46,236 37,720 5,522 5,980 10,260 105,718 55,888 33,327 5.966 11,964 8,784 115,929 91,807 50,503 142,310 248,028 93,735 48,914 142,649 258,578 45,174 40,201 45,898 70,400 (584) (3,454) 90,488 $ 338,516 107,147 $365,725 CONSOLIDATED STATEMENTS OF 12 Months Ended COMPREHENSIVE INCOME - USD ($) $ in Millions Sep. 28, 2019 Sep. 29, 2018 Sep. 30, 2017 Statement of Comprehensive Income [Abstract] Net income $ 55,256 $ 59,531 $ 48,351 Other comprehensive income/(loss): Change in foreign currency translation, (408) (525) 224 net of tax Change in unrealized gains/losses on derivative instruments, net of tax: Change in fair value of derivatives (661) 523 1,315 Adjustment for net (gains)/losses 23 382 (1,477) realized and included in net income Total change in unrealized gains/losses (638) 905 on derivative instruments (162) Change in unrealized gains/losses on marketable securities, net of tax: Change in fair value of marketable 3,802 securities (3,407) (782) Adjustment for net (gains)/losses (64) realized and included in net income Total change in unrealized gains/losses 3,827 (3,406) (846) on marketable securities Total other comprehensive income/(loss) 2,781 (3,026) (784) Total comprehensive income $ 58,037 $ 56,505 $ 47,567 25 1 12 Months Ended Sep. 28, 2019 Sep. 29, 2018 Sep 30, 2017 $ 25,913 $ 20.289 $20.484 55.256 59.531 18.351 12,547 6,068 (3401 10.903 5.340 (32.5901 10.157 4,840 5.966 (166) (2.723) 828 (8.0101 CONSOLIDATED STATEMENTS OF CASH FLOWS. USD (5) Sin Millions Statement of Cash Flows [Abstract] Cash, cash equivalents and restricted cash, beginning balances Operating activities: Net income Adjustments to reconcile net income to cash generated by operating activities: Depreciation and amortization Share-based compensation expense Deferred income tax expense benefit) Other Changes in operating assets and liabilities: Accounts receivable.net Inventories Vendor non-trade receivables Other current and non-current assets Accounts payable Deferred revenue Other current and non-current liabilities Cash generated by operating activities Investing activities: Purchases of marketable securities Proceeds from maturities of marketable securities Proceeds from sales of marketable securities Payments for acquisition of property plant and equipment Payments made in connection with business acquisitions, net Purchases of non-marketable securities Proceeds from non-marketable securities Other Cash generated by used in investing activities Financing activities: Proceeds from issuance of common 245 (289) 2,931 873 (1.923) 1625) (4.700) 69,391 9.175 (3) 38,449 77.04 318) 8.966 1593 1.092 64.225 (39,630) 40,102 (71.356 55,881 31.775 56,988 47.838 94564 (10,495 (13.313) (12.451) (1.001) (521) 1,634 (721) (1.871) 353 (745) 16,066 (1.078) (124) 45,896 (46.445 781 555 (2,817) (2.527 (1.874) 13.712 12.760 Payments for taxes related to net share settement of equity awards Payments for dividends and dividend equivalents Repurchases of common stock Proceeds from issuance of term debt, net Repayments of term debt Proceeds from Repayments of commercial paper, 14.119 166,897) 6,963 (8.805 (72.738) 6.960 (6.500) (37) 132.900) 28.662 3.500) 3.852 (5.977) (105) 190.976 24.311 o (87.876) (17.974 5.624 (195 Cash used in financing activities Increase/Decrease) in cash, cash equivalents and restricted cash Cash, cash equivalents and restricted cash, ending balances Supplemental cash flow disclosure: Cash paid for income taxes, net Cash paid for interest 50,224 25.913 20.289 15.263 $3,423 10.417 $3.022 11.591 $ 2.092 Total Common stock and additional paid in capital $ 31.251 Retained earnings $ 96,364 Accumulated other comprehensive income foss) $128.249 $ 634 555 (1.468) (581) 4,909 620 620 48,351 48,351 (12.803) (33.001) (784) $ 134,047 (784) (150) 35.867 98.330 $2.40 (1,778) (948) 5.443 ument CONSOLIDATED STATEMENTS OF SHAREHOLDERS' EQUITY - USD ($) Sin Millions Beginning balances at Sep. 24, 2016 Increase (Decrease) in Stockholders' Equity (Roll Forward] Common stock issued Common stock withheld related to net share settlement of equity awards Share-based compensation Tax benefit from equity awards, including transfer pricing adjustments Net income Dividends and dividend equivalents declared Common stock repurchased Other comprehensive income/floss) Ending balances at Sep 30, 2017 Increase (Decrease) in Stockholders' Equity (Roll Forward] Dividends and dividend equivalents declared per share or RSU (in dollars per share or RSU) Common stock issued Common stock withheld related to net share settlement of equity awards Share-based compensation Tax benefit from equity awards, including transfer pricing adjustments Net income Dividends and dividend equivalents declared Common stock repurchased Other comprehensive income foss) Ending balances at Sep. 29, 2018 Increase (Decrease) in Stockholders' Equity (Roll Forward) Dividends and dividend equivalents declared per share or RSU (in dollars per share or RSU) Common stock issued Common stock withheld related to net share settlement of equity awards Share-based compensation Tax benefit from equity awards, including transfer pricing adjustments Net income Dividends and dividend equivalents declared Common stock repurchased Other comprehensive income foss) Ending balances at Sep. 28, 2019 Increase (Decrease) in Stockholders Equity (Roll Forward) Dividends and dividend equivalents declared per share or ASU (in dollars per share or RSU) 0 $ 59,531 59,531 (13.735) (73,056) (3,026) $ 107,147 (3,026) (3,454) 40,201 70,400 $ 272 781 (1.029) (2,002) 6,194 0 $ 55,256 55,256 (14,129) (67.101) (67.100) 2.781 $ 90,488 2.781 $(584) $ 45,174 $ 45,898 $ 3.00 Income Statement All numbers in thousands Get access to 40+ years of historical data with Yahoo Finance Premium. Learn more TTM 9/30/2019 260.174,000 9/30/2018 265.595.000 163.756.000 9/30/2017 229.234.000 273,857.000 169.277.000 161,782,000 141.048.000 Breakdown > Total Revenue Cost of Revenue Gross Profit > Operating Expense Operating Income 104,580,000 98.392.000 101,839,000 88.186.000 37.442.000 34.462.000 30,941,000 26.842.000 67,138,000 63.930.000 70,898,000 61.344.000 1,052.000 1,385,000 2.446,000 2,878,000 > Net Non Operating interest > Other Income Expense Pretax Income 127,000 422,000 -441,000 -133,000 68.317,000 65.737 000 72.903.000 64.089.000 Tax Provision 9,893,000 10.481.000 15.738.000 58.424.000 55.256.000 13,372,000 59,531,000 59,531,000 > Net Income Common Stockh Diluted NI Available to Com Sto. 48.351.000 58,424,000 55,256,000 48.351.000 Basic EPS 0.012 0.012 0.0093 0.0119 0.0119 0.0092 4,617,834 4,955.377 5.217.242 4,648,913 5,000,109 5.251,692 Diluted EPS Basic Average Shares Diluted Average Shares Total Operating Income as Rep... Total Expenses Net Income from Continuing & - 67,138,000 63,930,000 70,898,000 61,344,000 206,719,000 196.244,000 194,697,000 167.890.000 58,424,000 55,256.000 59,531,000 48.351.000 Normalized Income 58,424,000 55.256.000 59.531,000 48.351.000 Interest income 4,101,000 4,961,000 5.686,000 5.201.000 Interest Expense 3,049,000 3,576,000 3.240,000 2.323.000 Net Interest Income 1,052,000 1.385,000 2.446,000 2.878.000 EBIT 71,366,000 69,313,000 76,143,000 66,412,000 EBITDA 82.899,000 Reconciled Cost of Revenue 169,277,000 161,782,000 141.048.000 163.756,000 10,903,000 11,533,000 12,547.000 10,157,000 Reconciled Depreciation Net Income from Continuing op Normalized EBITDA 58,424,000 55.256.000 59,531,000 48,351,000 82.899,000 81.860.000 87,046,000 76,569.000 Tax Rate for Calcs 0 0 0 Tax Effect of Unusual Items 0 0 0