Answered step by step
Verified Expert Solution
Question
1 Approved Answer
Using Excel, how do I use the CAPM formula to figure out the Expected Return Rate for a two-asset portfolio? I have the beta for
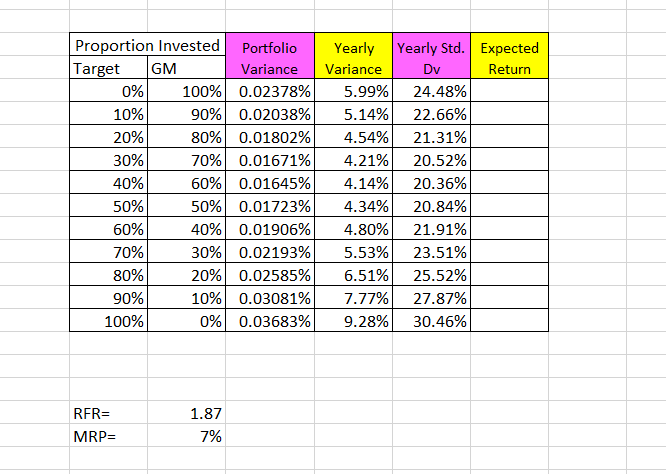
Using Excel, how do I use the CAPM formula to figure out the Expected Return Rate for a two-asset portfolio? I have the beta for two different stocks but I want to plot the information on one graph showing the Expected Risk on the x axis and the Expected Return on the y-axis? I have completed this much of the data so far. Additionally, the beta for target is 0.758 and the beta GM is 1.193. I understand how to calculate for one stock at a time but not together...

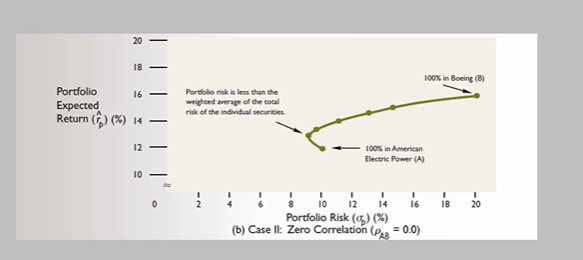
I am ultimately trying to use the table above to create a chart like this one:
Proportion Invested Portfolio Target GM Variance 0% 100% 0.02378% 10% 90% 0.02038% 20% 80% 0.01802% 30% 70% 0.01671% 40% 60% 0.01645% 50% 50% 0.01723% 60% 40% 0.01906% 70% 30% 0.02193% 80% 20% 0.02585% 90% 10% 0.03081% 100% 0% 0.03683% Yearly Variance 5.99% 5.14% 4.54% 4.21% 4.14% 4.34% 4.80% 5.53% 6.51% 7.77% 9.28% Yearly Std. Expected Dv Return 24.48% 22.66% 21.31% 20.52% 20.36% 20.84% 21.91% 23.51% 25.52% 27.87% 30.46% RFR= MRP= 1.87 7% 20 - 18 - 100% in Boeing (B) 16 - Portfolio Expected Return () (%) 14 Pordolio risk is less than the weighted average of the total risk of the individual securities 12 - 100% in American Electric Power (A) 10 0 14 18 ! 20 16 Portfolio Risk () (%) (b) Case It: Zero Correlation (Pse = 0.0)
Step by Step Solution
There are 3 Steps involved in it
Step: 1

Get Instant Access to Expert-Tailored Solutions
See step-by-step solutions with expert insights and AI powered tools for academic success
Step: 2

Step: 3

Ace Your Homework with AI
Get the answers you need in no time with our AI-driven, step-by-step assistance
Get Started


