

Answered step by step
Verified Expert Solution
Question
1 Approved Answer
USING EXCELL From the file CanadianSalesData.xlsx, generate the following ten results using pivot tables. Each pivot table should appear on a separate worksheet. Within each
USING EXCELL 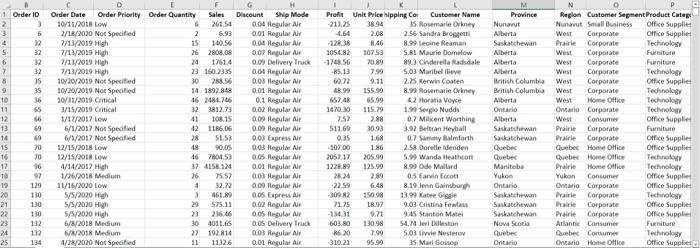 From the file CanadianSalesData.xlsx, generate the following ten results using pivot tables. Each pivot table should appear on a separate worksheet. Within each pivot table, the cell(s) containing the required information should be highlighted, preferably in light orange. In the highlight tab, the theme colors block has Orange, Accent 2, Lighter 60% you can hover your cursor over colors to see their names. But if you have trouble figuring it out, any non-obnoxious light color shade for highlighting is fine.
From the file CanadianSalesData.xlsx, generate the following ten results using pivot tables. Each pivot table should appear on a separate worksheet. Within each pivot table, the cell(s) containing the required information should be highlighted, preferably in light orange. In the highlight tab, the theme colors block has Orange, Accent 2, Lighter 60% you can hover your cursor over colors to see their names. But if you have trouble figuring it out, any non-obnoxious light color shade for highlighting is fine.1) Show the sum of Sales for Product Category = Technology and Province = Quebec
2) Show the sum of Profit for Order Priority = Critical and Ship Mode = Regular Air, separately for each month from 3/2020 to 5/2020 (use Ship Date)
3) Show the 10 orders (use Order ID) with the highest Sales during 2020 (use Order Date)
4) Show all orders (use Order ID) where Profit is negative and the Customer Segment is Corporate
5) From the Region with the highest sum of Sales, show the three Customer Names with the highest sum of Sales
6) Show the average Sales value for each combination of Product Container and Order Priority
7) Show the average Profit value for each combination of Ship Mode and Customer Segment
8) For each Region, show the sum of Sales separately for each month from 10/2019 to 12/2019 (use Ship Date)
9) For the entire year 2020, show each Product Category's sum of Profit as a percentage of the sum of all Profit during the year (use Ship Date)
10) Show the 10 largest Order Quantities where Product Container = Jumbo Box and Province = Ontario
Step by Step Solution
There are 3 Steps involved in it
Step: 1

Get Instant Access to Expert-Tailored Solutions
See step-by-step solutions with expert insights and AI powered tools for academic success
Step: 2

Step: 3
Ace Your Homework with AI
Get the answers you need in no time with our AI-driven, step-by-step assistance
Get Started
An Introduction To Statistical Sampling In Auditing
Authors: Dan M. Guy
1st Edition
0471042323, 978-0471042327