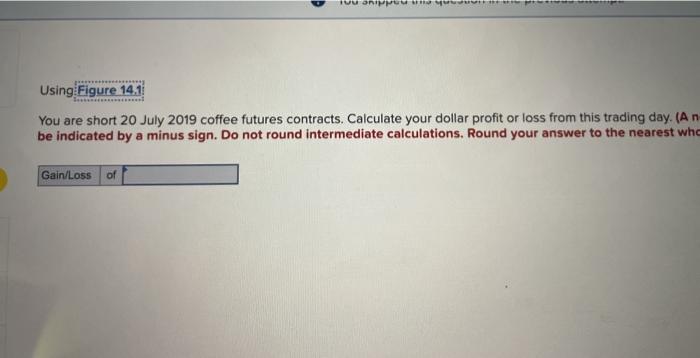
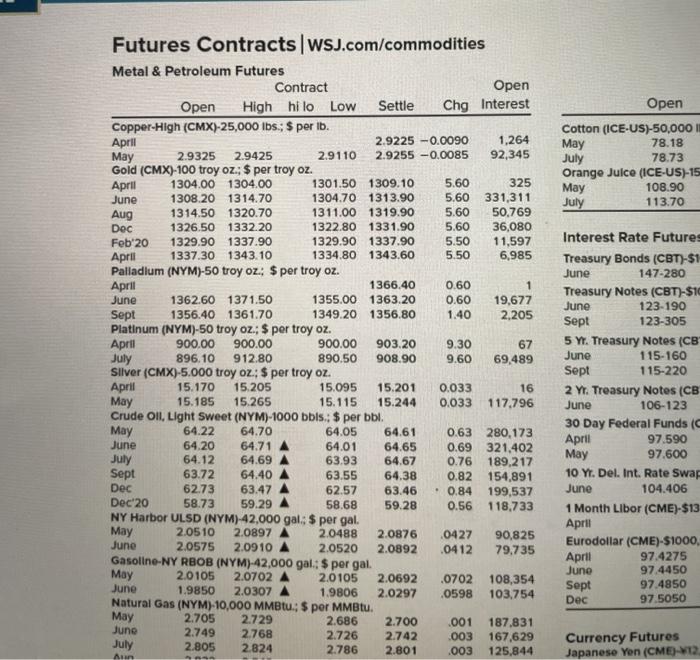
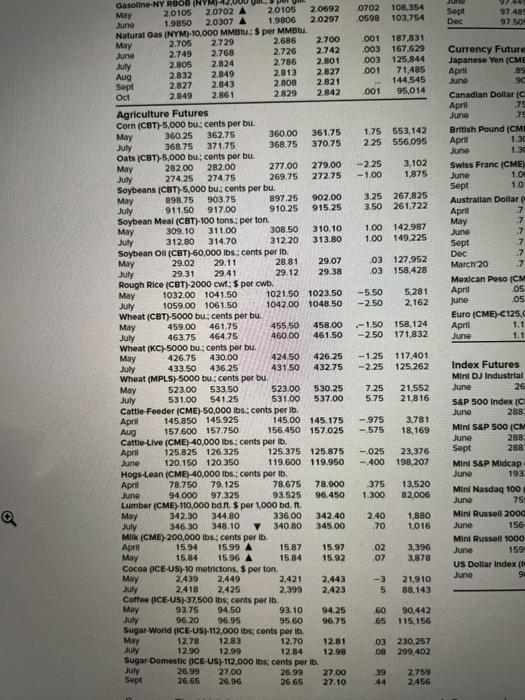
Using Figure 14.1 You are short 20 July 2019 coffee futures contracts. Calculate your dollar profit or loss from this trading day. (An be indicated by a minus sign. Do not round intermediate calculations. Round your answer to the nearest whe Gain/Loss of Open Cotton (ICE-US)-50,000 11 May 78.18 July 78.73 Orange Juice (ICE-US)-15 May 108.90 July 113.70 Futures Contracts | WSJ.com/commodities Metal & Petroleum Futures Contract Open Open High hilo Low Settle Chg Interest Copper-High (CMX)-25,000 lbs.; $ per ib. April 2.9225 -0.0090 1,264 May 2.9325 2.9425 2.9110 2.9255 -0.0085 92,345 Gold (CMX)-100 troy oz; $ per troy oz. April 1304.00 1304.00 1301.50 1309.10 5.60 325 June 1308.20 1314.70 1304.70 1313.90 5.60 331,311 Aug 1314.50 1320.70 1311.00 1319.90 5.60 50.769 Dec 1326.50 1332.20 1322.80 1331.90 5.60 36,080 Feb 20 1329.90 1337.90 1329.90 1337.90 5.50 11,597 April 1337.30 1343.10 1334.80 1343.60 5.50 6,985 Palladium (NYM)-50 troy oz; $ per troy oz. April 1366.40 0.60 1 June 1362.60 1371.50 1355.00 1363.20 0.60 19,677 Sept 1356.40 1361.70 1349.20 1356.80 1.40 2,205 Platinum (NYM)-50 troy oz.; $ per troy oz. April 900.00 900.00 900.00 903.20 9.30 67 July 896.10 912.80 890.50 908.90 9.60 69,489 Silver (CMX)-5.000 troy oz: $ per troy oz. April 15.170 15.205 15.095 15.201 0.033 16 May 15.185 15.265 15.115 15.244 0.033 117.796 Crude Oil, Light Sweet (NYM)-1000 bbls.: $ per bbl. May 64.22 64.70 64.05 64.61 0.63 280,173 June 64.20 64.71 A 64.01 64.65 0.69 321,402 64.12 64.69 A 63.93 64.67 0.76 189.217 Sept 63.72 64.40 A 63.55 64.38 0.82 154,891 Dec 62.73 63.47 62.57 63.46 0.84 199,537 Dec 20 58.73 59.29 58.68 59.28 0.56 118.733 NY Harbor ULSD (NYM) 42,000 gal: $ per gal. May 2.0510 2.0897 2.0488 2.0876 0427 90,825 June 2.0575 2.0910 A 2.0520 2.0892 .0412 79,735 Gasoline-NY RBOB (NYM)-42,000 gal; $ per gal. May 2.0 105 2.0702 2.0105 2.0692 .0702 108,354 June 1.9850 2.0307 A 1.9806 2.0297 .0598 103,754 Natural Gas (NYM)-10,000 MMBtu; $ per MMBtu. May 2.705 2.729 2.686 2.700 .001 187.831 2.749 2.768 2.726 2.742 .003 167,629 July 2.805 2.824 2.786 2.801 .003 125,844 Interest Rate Futures Treasury Bonds (CBT)-51 June 147-280 Treasury Notes (CBT)-$10 June 123-190 Sept 123-305 5 Y. Treasury Notes (CB June 115-160 Sept 115-220 2 Y. Treasury Notes (CB June 106-123 30 Day Federal Funds ( April 97.590 May 97.600 10 Y. Del. Int. Rate Swa June 104.406 1 Month Libor (CME)-$13 April Eurodollar (CME)-S1000, April 97.4275 June 97.4450 Sept 97.4850 Dec 97.5050 July June Currency Futures Japanese Yen (CME-V12 Ain 0702 108,354 0598 103,754 Sept Doc 97.48 97 50+ Gasoline-NY ROOD (NYM 42,00 May 2.0105 20702 A 2.0105 2.0692 junio 1.9850 2.0307 A 1.9806 2.0297 Natural Gas (NYM) 10.000 MMBU: $ per MMBtu. May 2.705 2.729 2686 2.700 June 2.749 2.768 2.726 2.742 July 2.805 2824 2.786 2.801 Aug 2832 2.849 2013 2.827 Sept 2.827 2.843 2.808 2.821 Oct 2.849 2.861 2.829 2.842 001 003 003 001 187,831 167,629 125.844 71.485 144,545 95,014 001 1.75 553,142 225 556,095 -2.25 -1.00 3.102 1.875 3.25 267,825 3.50 261,722 Currency Future Japanese Yen (CME April 89 96 Canadian Dollar (C April 75 Juno 7 British Pound (CML April 1.30 Juno 1.30 Swiss Franc (CME June 1.0! Sept 1.0 Australian Dollar April .7 May June Sept Dec -7 March 20 7 Mexican Peso (CM April .05 June 05 Euro (CME)-C125 April June 1.1 1.00 142,987 1.00 149.225 .03 127.952 03 158,428 -5.50 -2.50 5.281 2.162 -1.50 158,124 -2.50 171,832 -1.25 -2.25 117.401 125.262 Agriculture Futures Corn (CBT)-5,000 bu: cents per bu. May 360.25 362.75 360.00 361.75 July 368.75 371.75 368.75 370.75 Oats (CBT)-5,000 bucents per bu. May 282.00 282.00 277.00 279.00 July 274 25 274.75 269.75 272.75 Soybeans (CBT)-5,000 bu: cents per bu. May 898.75 903.75 897.25 902.00 July 911.50 917.00 910.25 915.25 Soybean Meal (CBT)-100 tons.. per ton May 309.10 311.00 308.50 310.10 July 312.80 314.70 312.20 313.80 Soybean Oil (CBT) 60,000 lbs.: cents per ib. May 29.02 29.11 28.81 29.07 July 29.31 29.41 29.12 29.38 Rough Rice (CBT)-2000 cwt; per cwb. May 1032.00 1041,50 1021.50 1023.50 July 1059.00 1061.50 104200 1048.50 Wheat (CBT)-5000 bu, cents per bu. May 459.00 461.75 455,50 458.00 July 463.75 464.75 460.00 461.50 Wheat (KC) 5000 bucents per bu. May 426.75 430.00 424.50 426.25 July 433.50 436.25 431.50 43275 Wheat (MPLS)-5000 bu: cents per bu. May 523.00 533.50 523.00 530.25 July 531.00 541.25 531.00 537.00 Cattle-Feeder (CME)-50,000 lbs.: cents per lb. April 145.850 145.925 145.00 145.175 Aug 157.600 157.750 156.450 157.025 Cattle-Live (CME) 40,000 lbs., cents per lb. April 125.825 126.325 125.375 125.875 June 120.150 120.350 119.600 119.950 Hogs-Lean (CME) 40,000 lbs: cents per ib. April 78.750 79.125 78.675 78.900 June 94.000 97.325 93.525 96.450 Lumber (CME)-110,000 bd.ft. S per 1.000 bd. It May 342.30 344.80 336.00 342.40 July 346 30 348.10 340.80 345.00 Milk (CME) 200,000 lbs., cents per ib. April 15.94 15.99 A 15.87 15.97 May 15.84 15.96 A 15.84 15.92 Cocoa (ICE-US)-10 metrictons, Sporton May 2.439 2,449 2.421 2.443 July 2418 2.425 2,399 2,423 Coffee ICE-US)-37.500 lbs, cents per i May 93.75 94.50 93.10 94.25 July 96,20 96.95 95.60 96.75 Sugar World (CE-US)-112,000 lbs, cents per in May 1278 12.83 12.70 12.81 July 12.90 12.99 12.84 12.98 Sugar Domestic (ICE-US)-112,000 lbs, cents per ib. July 26.99 27.00 26.99 27.00 Sept 26.65 26.96 26.65 27.10 7.25 5.75 21.552 21,816 -975 -575 3,781 18,169 -025 - 400 23.376 198,207 Index Futures Mini DJ Industrial June 26 S&P 500 Index (CH June 288 Mini S&P 500 (CM June 288 Sept 288 Mini S&P Midcap June 193 Mini Nasdaq 100 June 75 Mini Russell 2000 June 156 Mini Russell 1000 June 159 US Dollar Index June 9: 375 1.300 13,520 82.006 2.40 70 1,880 1,016 .02 07 3.396 3,878 -3 5 21.910 88,143 60 .65 90.442 115, 156 03 230,257 OB 299,402 2.759 2.456


