- Using financial ratio analysis, evaluate American Apparels financial performance for the past five years.
Leverage Ratio Analysis
- Ratio of Total Liabilities-To-Total Assets
- Ratio of Long-Term Liabilities-To-Equity
- Ratio of Total Liabilities-To-Equity
Coverage Ratio Analysis
Liquidity and Solvency Ratio Analysis
- Current Ratio
- Quick Ratio
Efficiency Ratio Analysis
- Working Capital Turnover
- Inventory Turnover
- Receivable Turnover
Profitability Ratio Analysis
- Net Profit Margin Ratio
- Gross Profit Ratio
- Rate Earned on Equity
- Rate Earned on Assets
Cash Performance
- Operating Cash Return on Equity
- Operating Cash Return on Assets
- Operating Cash Return to Revenue
- Analyze the companys financial statements on the basis of its common size statements. What additional insights do these statements provide?
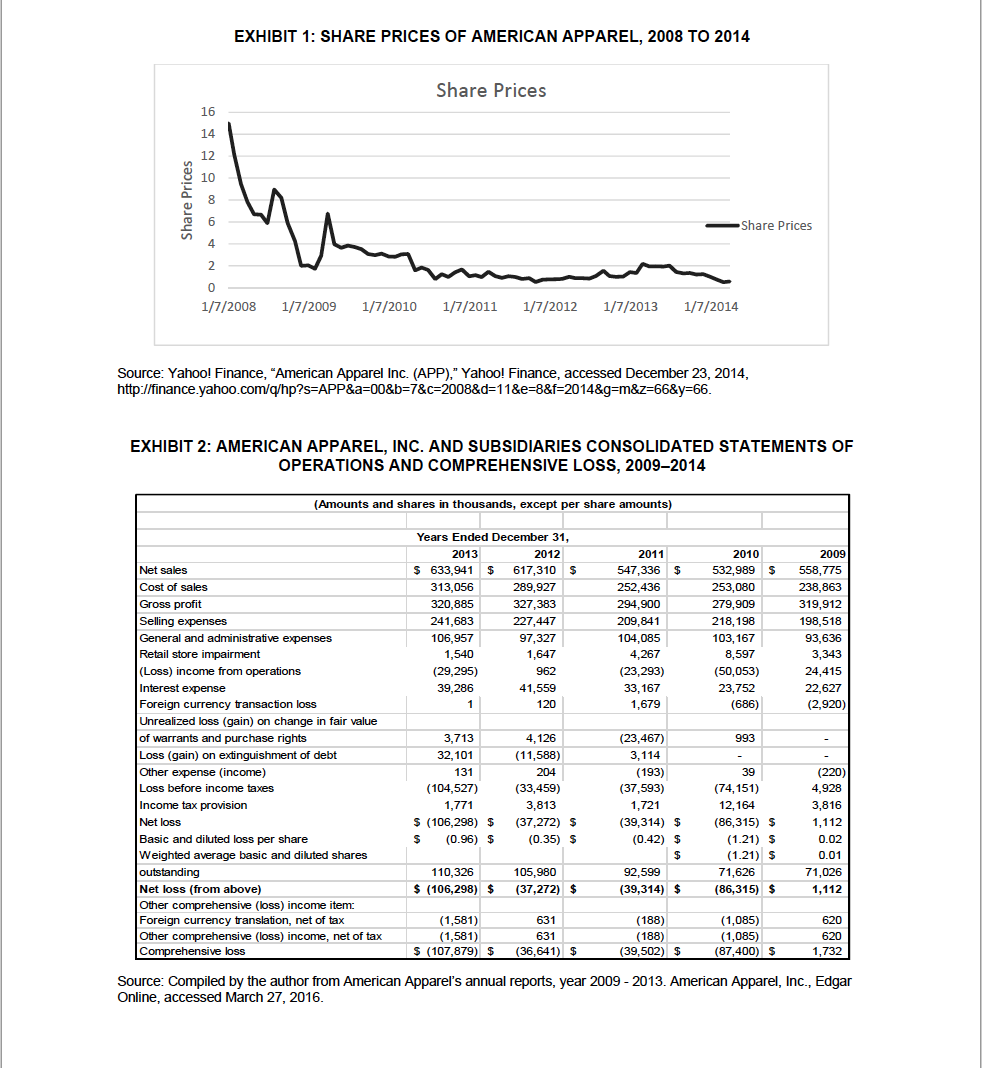
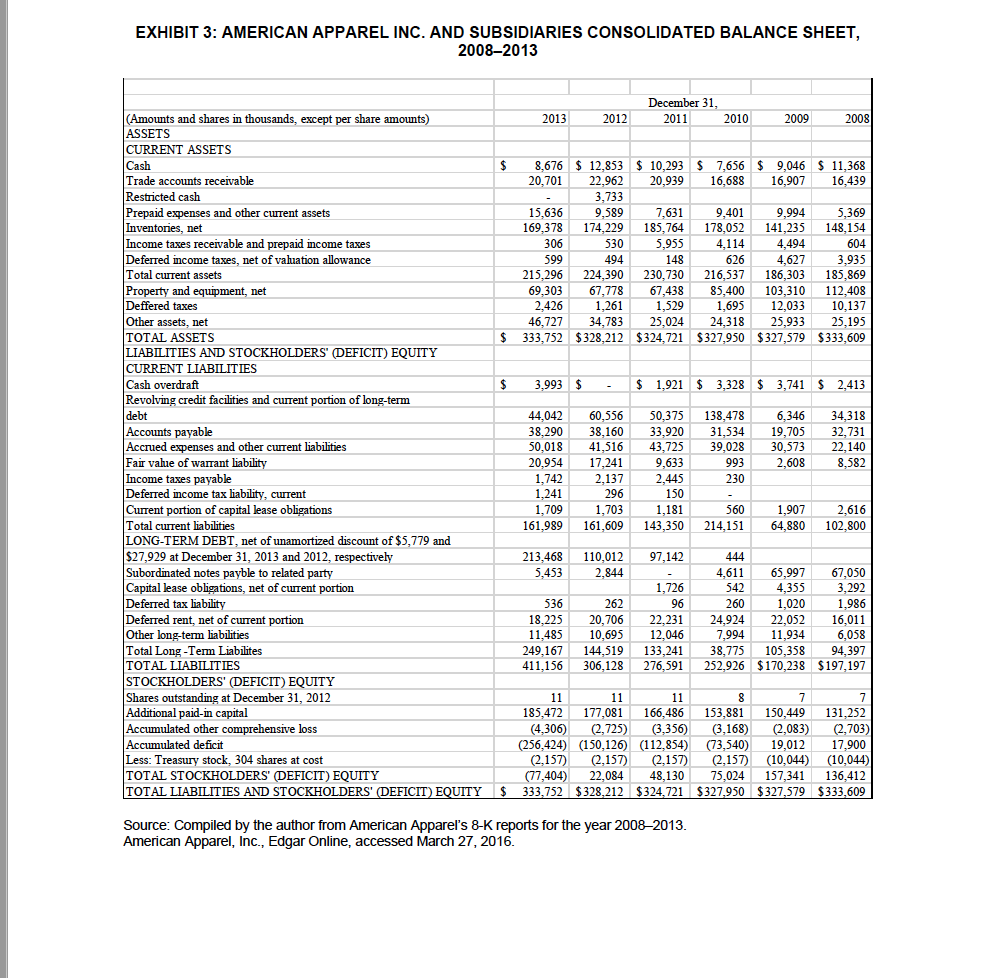
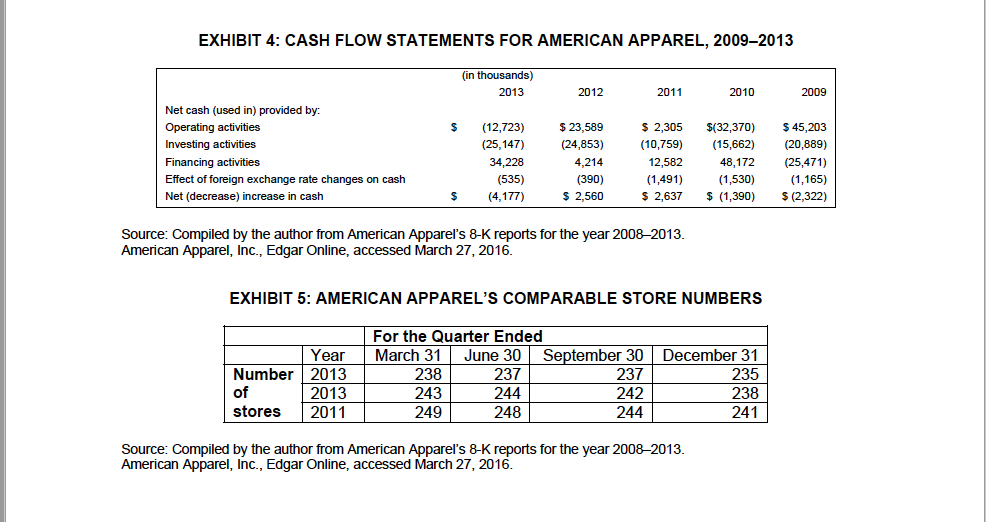
EXHIBIT 1: SHARE PRICES OF AMERICAN APPAREL, 2008 TO 2014 Share Prices Share Prices Share Prices 1/7/2008 1/7/2009 1/7/2010 1/7/2011 1/7/2012 1/7/2013 1/7/2014 Source: Yahoo! Finance, "American Apparel Inc. (APP)," Yahoo! Finance, accessed December 23, 2014, http://finance.yahoo.com/q/hp?s=APP&a=00&b=7&c=2008&d=11&e=8&t=2014&g=m&z=66&y=66. EXHIBIT 2: AMERICAN APPAREL, INC. AND SUBSIDIARIES CONSOLIDATED STATEMENTS OF OPERATIONS AND COMPREHENSIVE LOSS, 2009-2014 (Amounts and shares in thousands, except per share amounts) $ $ Years Ended December 31, 2013 2012 $ 633,941 $ 617,310 $ 313,056 289,927 320,885 327,383 241,683 227,447 106,957 97,327 1,540 1,647 (29,295) 962 39,286 41,559 120 2011 547,336 252,436 294,900 209,841 104,085 4,267 (23,293) 33, 167 1,679 2010 532,989 253,080 279,909 218,198 103, 167 8,597 (50,053) 23,752 (686) 2009 558,775 238,863 319,912 198,518 93,636 3,343 24,415 22,627 (2,920) 993 Net sales Cost of sales Gross profit Selling expenses General and administrative expenses Retail store impairment (Loss) income from operations Interest expense Foreign currency transaction loss Unrealized loss (gain) on change in fair value of warrants and purchase rights Loss (gain) on extinguishment of debt Other expense (income) Loss before income taxes Income tax provision Net loss Basic and diluted loss per share Weighted average basic and diluted shares outstanding Net loss (from above) Other comprehensive (loss) income item: Foreign currency translation, net of tax Other comprehensive (loss) income, net of tax Comprehensive loss 3,713 32, 101 131 (104,527) 1,771 $ (106,298) $ $ (0.96) $ 4, 126 (11,588) 204 (33,459) 3,813 (37,272) $ (0.35) $ (23,467) 3,114 (193) (37,593) 1,721 (39,314) $ (0.42) $ 39 (74,151) 12,164 (86,315) $ (1.21) $ (1.21) $ 71,626 (86,315) $ (220) 4,928 3,816 1,112 0.02 0.01 71,026 1,112 110,326 $ (106,298) $ 105,980 (37,272) $ 92,599 (39,314) $ (1,581) (1,581) S (107,879) $ 631 631 (36,641) $ (188) (188) (39,502) $ (1,085) (1,085) (87,400) $ 620 620 1,732 Source: Compiled by the author from American Apparel's annual reports, year 2009 - 2013. American Apparel, Inc., Edgar Online, accessed March 27, 2016. EXHIBIT 3: AMERICAN APPAREL INC. AND SUBSIDIARIES CONSOLIDATED BALANCE SHEET, 2008-2013 December 31, 2011 2010 2013 2012 2009 2008 $ 8,676 20,701 9,046 16,907 $ 11,368 16,439 15,636 169,378 306 599 215,296 69,303 2.426 46,727 333,752 $ 12,853 $ 10,293 $ 7,656 22,962 20,939 16,688 3,733 9,589 7,6319,401 174,229 185,764 178,052 530 5,955 4,114 494 148 626 224,390 230,730 216,537 67,778 67,438 85,400 1,261 1,529 1,695 34,783 25,024 24,318 $328,212 $324,721 $327,950 9,994 5,369 141,235 148,154 4,494 604 4,627 3.935 186,303 185,869 103,310 112,408 12,033 10.137 25,933 25,195 $327,579 $333,609 $ 3,993 $ - $ 1,921 $ 3,328 $ 3,741 $ 2,413 (Amounts and shares in thousands, except per share amounts) ASSETS CURRENT ASSETS Cash Trade accounts receivable Restricted cash Prepaid expenses and other current assets Inventories, net Income taxes receivable and prepaid income taxes Deferred income taxes, net of valuation allowance Total current assets Property and equipment, net Deffered taxes Other assets, net TOTAL ASSETS LIABILITIES AND STOCKHOLDERS' (DEFICIT) EQUITY CURRENT LIABILITIES Cash overdraft Revolving credit facilities and current portion of long-term debt Accounts payable Accrued expenses and other current liabilities Fair value of warrant liability Income taxes payable Deferred income tax liability, current Current portion of capital lease obligations Total current liabilities LONG-TERM DEBT, net of unamortized discount of $5,779 and $27,929 at December 31, 2013 and 2012, respectively Subordinated notes payble to related party Capital lease obligations, net of current portion Deferred tax liability Deferred rent, net of current portion Other long-term liabilities Total Long-Term Liabilites TOTAL LIABILITIES STOCKHOLDERS' (DEFICIT) EQUITY Shares outstanding at December 31, 2012 Additional paid-in capital Accumulated other comprehensive loss Accumulated deficit Less: Treasury stock, 304 shares at cost TOTAL STOCKHOLDERS' DEFICIT) EQUITY TOTAL LIABILITIES AND STOCKHOLDERS' (DEFICIT) EQUITY 6,346 19,705 30,573 2,608 44,042 38.290 50,018 20,954 1,742 1,241 1 1,709 161,989 34,318 32,731 22,140 8,582 60,556 38,160 41,516 17,241 2,137 296 1,703 161,609 138,478 31,534 39,028 993 230 50,375 33.920 43,725 9,633 2,445 150 1,181 143,350 560 214,151 1,907 64,880 2,616 102,800 97,142 213,468 5,453 110,012 2,844 536 18,225 11,485 249,167 411,156 262 20,706 10,695 144,519 306,128 1,726 96 22,231 12,046 133,241 276,591 444 4,611 542 260 24,924 7 ,994 3 8,775 252,926 65,997 4,355 1,020 22,052 11,934 105,358 $170,238 67,050 3,292 1.986 16,011 6,058 94,397 $ 197,197 7 11 11 11 185,472 177,081 166,486 (4,306) (2,725) (3,356) (256,424) (150,126) (112,854) (2.157) (2,157) (2.157) (77,404) 22,084 48,130 333,752 $328,212 $324,721 153,881 150,449 (3,168) (2,083) (73,540) 19,012 (2,157) (10.044) 75.024 157,341 $327,950 $327,579 131,252 (2,703) 17,900 (10,044) 136,412 $333,609 $ Source: Compiled by the author from American Apparel's 8-K reports for the year 20082013. American Apparel, Inc., Edgar Online, accessed March 27, 2016. EXHIBIT 4: CASH FLOW STATEMENTS FOR AMERICAN APPAREL, 2009-2013 (in thousands) 2013 2012 2011 2010 2009 Net cash (used in) provided by: Operating activities Investing activities Financing activities Effect of foreign exchange rate changes on cash Net (decrease) increase in cash (12,723) (25, 147) 34,228 (535) (4,177) $ 23,589 (24,853) 4,214 $ 2,305 (10,759) 12,582 (1,491) $ 2,637 $(32,370) (15,662) 48,172 (1,530) $ (1,390) $ 45,203 (20,889) (25,471) (1,165) S (2,322) (390) $ 2,560 Source: Compiled by the author from American Apparel's 8-K reports for the year 2008-2013. American Apparel, Inc., Edgar Online, accessed March 27, 2016. EXHIBIT 5: AMERICAN APPAREL'S COMPARABLE STORE NUMBERS Year Number 2013 2013 stores 2011 For the Quarter Ended March 31 June 30 September 30 December 31 238 237 237 235 243 244 242 238 248 244 241 249 Source: Compiled by the author from American Apparel's 8-K reports for the year 20082013. American Apparel, Inc., Edgar Online, accessed March 27, 2016