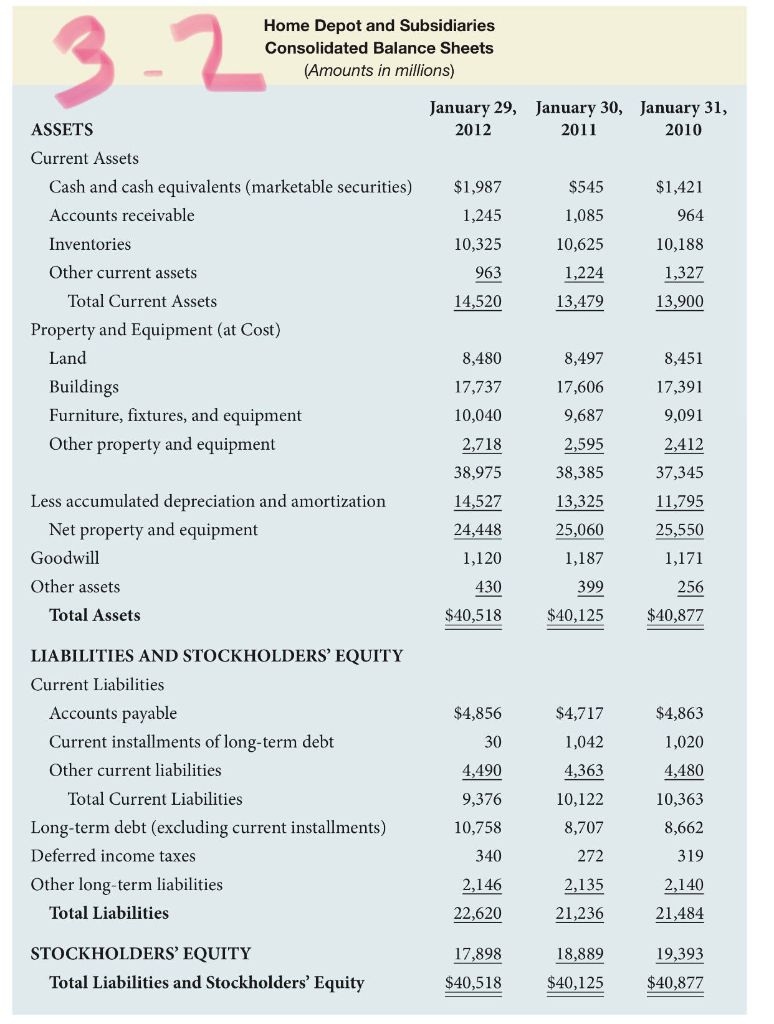
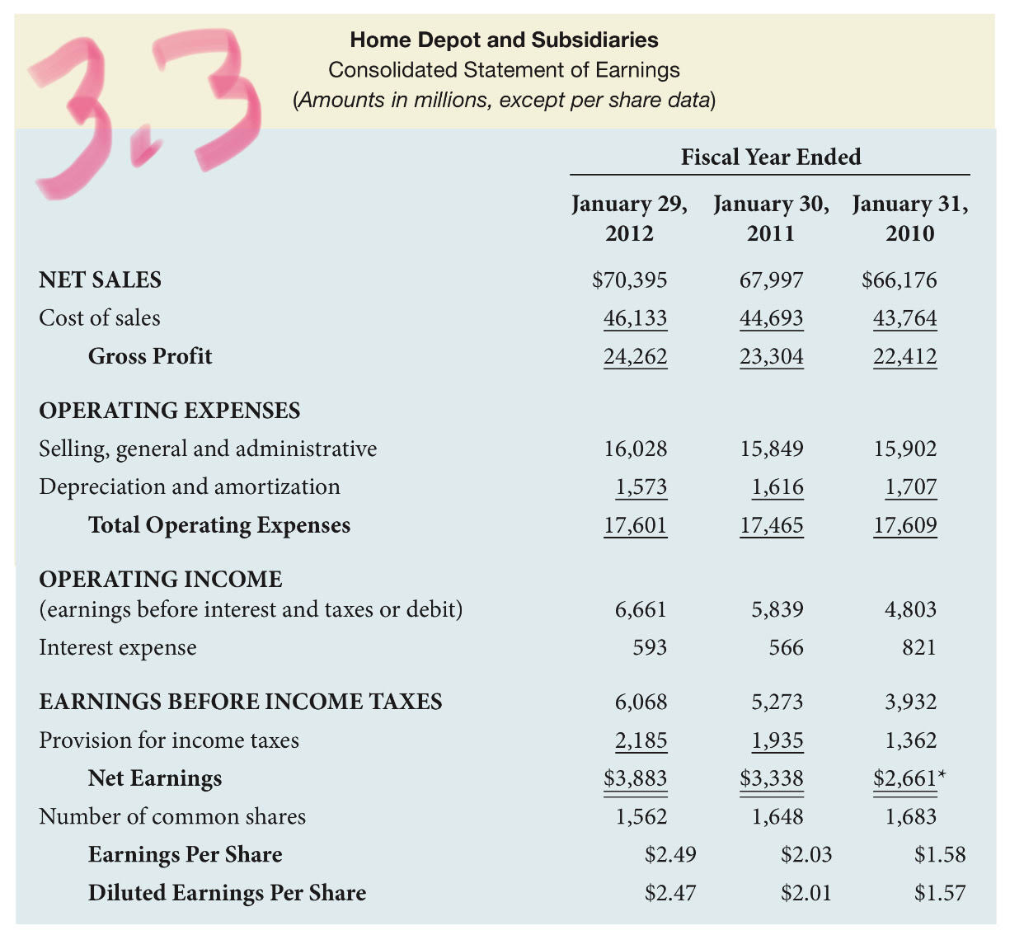
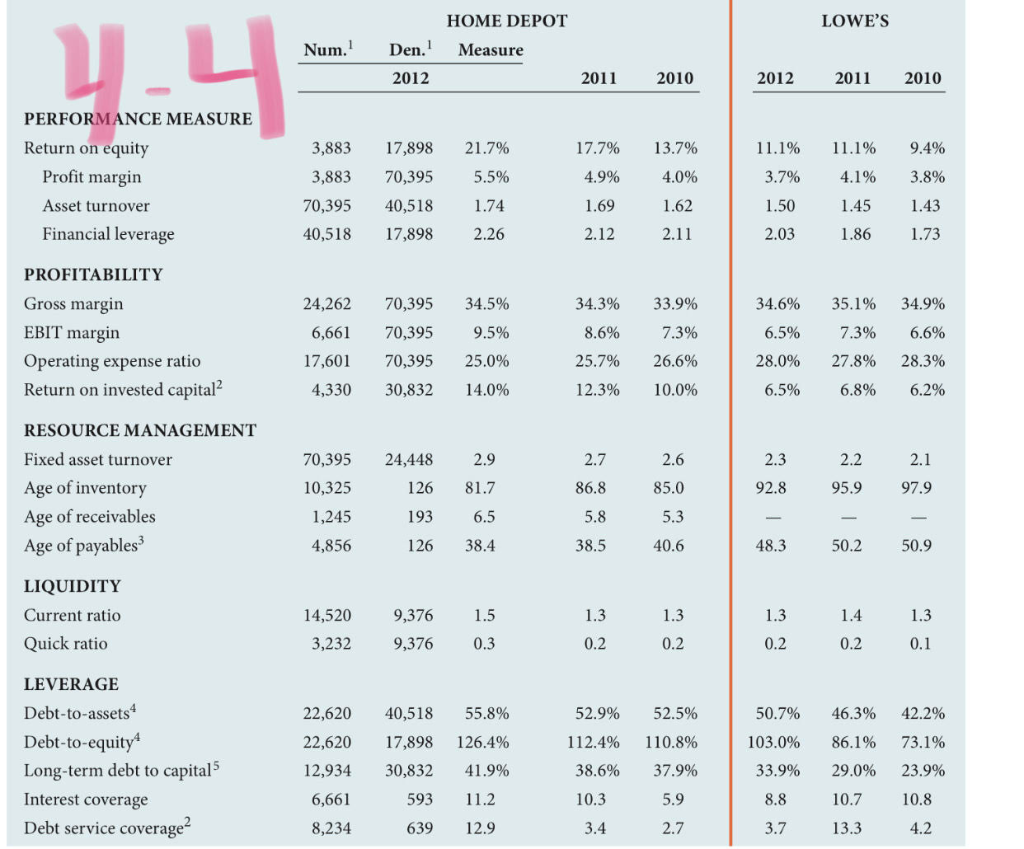
Using Home Depots 2010 and 2011 balance sheets in Figure 3.2 and statements of earnings in Figure 3.3 in Chapter 3, set up the rations presented in Figure 4.4 for HD for 2010 and 2011, indicating the numerator and denominator of each. Confirm the answers presented in 4.4. 


Home Depot and Subsidiaries Consolidated Balance Sheets (Amounts in millions) January 29, January 30, January 31, 2012 2011 2010 ASSETS Current Assets Cash and cash equivalents (marketable securities) Accounts receivable Inventories Other current assets Total Current Assets Property and Equipment (at Cost) Land Buildings Furniture, fixtures, and equipment Other property and equipment $1,987 1,245 10,325 963 14,520 $545 1,085 10,625 1,224 13,479 $1,421 964 10,188 1,327 13,900 8,480 17,737 10,040 2,718 38,975 14,527 24,448 1,120 430 $40,518 8,497 17,606 9,687 2,595 38,385 13,325 25,060 1,187 8,451 17,391 9,091 2,412 37,345 11,795 25,550 1,171 256 $40,877 Less accumulated depreciation and amortization Net property and equipment Goodwill Other assets Total Assets 399 $40,125 LIABILITIES AND STOCKHOLDERS' EQUITY Current Liabilities Accounts payable Current installments of long-term debt Other current liabilities Total Current Liabilities Long-term debt (excluding current installments) Deferred income taxes Other long-term liabilities Total Liabilities $4,856 30 4,490 9,376 10,758 340 $4,717 1,042 4,363 10,122 8,707 272 2,135 21,236 $4,863 1,020 4,480 10,363 8,662 319 2,146 22,620 2,140 21,484 19,393 STOCKHOLDERS' EQUITY Total Liabilities and Stockholders' Equity 17,898 $40,518 18,889 $40,125 $40,877 Home Depot and Subsidiaries Consolidated Statement of Earnings (Amounts in millions, except per share data) Fiscal Year Ended January 29, 2012 January 30, January 31, 2011 2010 NET SALES Cost of sales Gross Profit $70,395 46,133 24,262 67,997 44,693 $66,176 43,764 22,412 23,304 OPERATING EXPENSES Selling, general and administrative Depreciation and amortization Total Operating Expenses 16,028 1,573 15,849 1,616 17,465 15,902 1,707 17,601 17,609 OPERATING INCOME (earnings before interest and taxes or debit) Interest expense 6,661 5,839 566 4,803 821 593 EARNINGS BEFORE INCOME TAXES 5,273 6,068 2,185 $3,883 1,562 $2.49 1,935 $3,338 3,932 1,362 $2,661* Provision for income taxes Net Earnings Number of common shares Earnings Per Share Diluted Earnings Per Share 1,683 1,648 $2.03 $1.58 $2.47 $2.01 $1.57 LOWE'S HOME DEPOT Measure Num. Den. 2012 2011 2010 2012 2011 2010 PERFORMANCE MEASURE Return on equity Profit margin Asset turnover Financial leverage 11.1% 3.7% 3,883 3,883 70,395 40,518 17,898 70,395 40,518 17,898 21.7% 5.5% 1.74 2.26 17.7% 4.9% 1.69 2.12 13.7% 4.0% 1.62 2.11 11.1% 4.1% 1.45 1.86 9.4% 3.8% 1.43 1.73 1.50 2.03 PROFITABILITY Gross margin EBIT margin Operating expense ratio Return on invested capital? 24,262 6,661 17,601 4,330 70,395 70,395 70,395 30,832 34.5% 9.5% 25.0% 14.0% 34.3% 8.6% 25.7% 12.3% 33.9% 7.3% 26.6% 10.0% 34.6% 6.5% 28.0% 6.5% 35.1% 7.3% 27.8% 6.8% 34.9% 6.6% 28.3% 6.2% 2.6 21 RESOURCE MANAGEMENT Fixed asset turnover Age of inventory Age of receivables Age of payables 2.2 95. 9 85.0 97. 70,395 10,325 1,245 4,856 24,448 126 193 126 2.9 81.7 6.5 38.4 2.7 86.8 5.8 38.5 5.3 40.6 48.3 50.2 50.9 LIQUIDITY Current ratio Quick ratio - 14,520 3,232 1.4 9,376 9,376 1.5 0.3 1.3 0.2 0.2 0.2 0.2 1.3 0.1 LEVERAGE Debt-to-assets Debt-to-equity Long-term debt to capital Interest coverage Debt service coverage 22,620 22,620 12,934 6,661 8,234 40,518 17,898 30,832 593 639 55.8% 126.4% 41.9% 11.2 12.9 52.9% 112.4% 38.6% 10.3 3.4 52.5% 110.8% 37.9% 5.9 2.7 50.7% 103.0% 33.9% 8.8 3.7 46.3% 86.1% 29.0% 10.7 13.3 42.2% 73.1% 23.9% 10.8 4.2


