Answered step by step
Verified Expert Solution
Question
1 Approved Answer
The financial information for the past two years (2018 and 2019) is provided. Using a spreadsheet application, such as Microsoft Excel, and the information
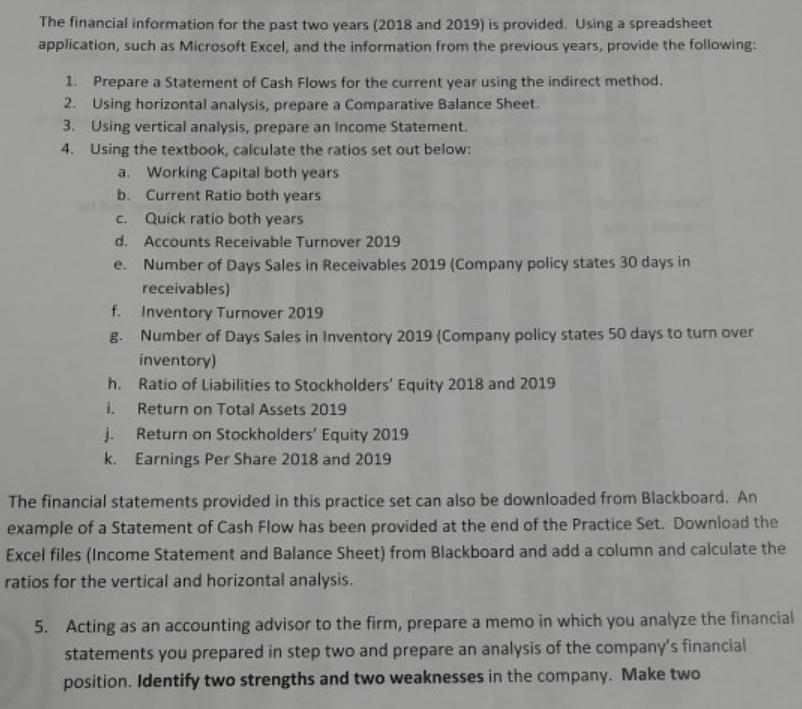
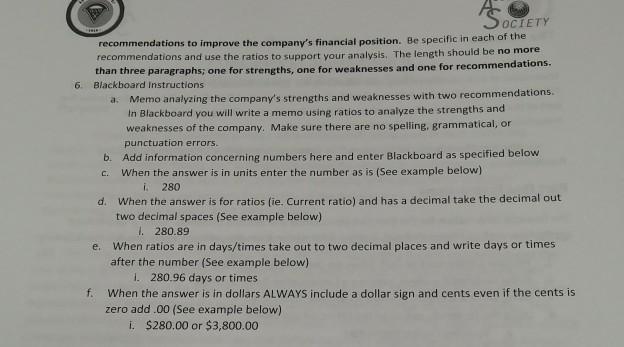
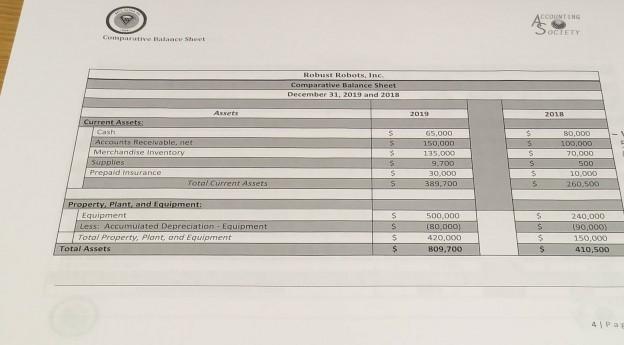
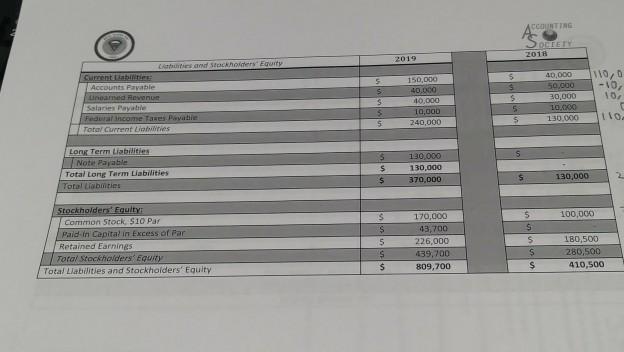
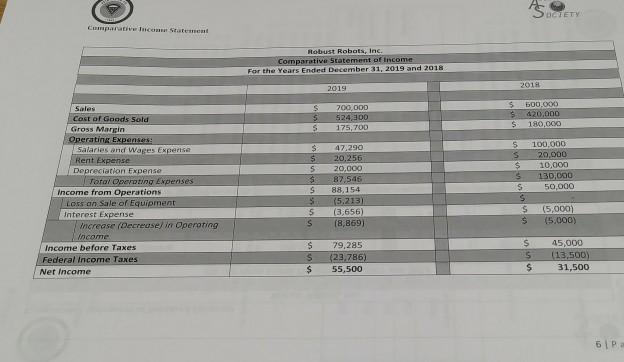
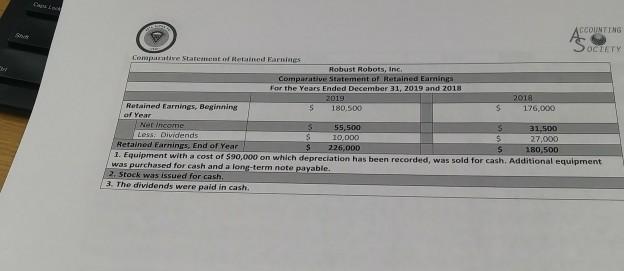
The financial information for the past two years (2018 and 2019) is provided. Using a spreadsheet application, such as Microsoft Excel, and the information from the previous years, provide the following: 1. Prepare a Statement of Cash Flows for the current year using the indirect method. 2. Using horizontal analysis, prepare a Comparative Balance Sheet. 3. Using vertical analysis, prepare an Income Statement. 4. Using the textbook, calculate the ratios set out below: a. Working Capital both years b. Current Ratio both years C. Quick ratio both years d. Accounts Receivable Turnover 2019 Number of Days Sales in Receivables 2019 (Company policy states 30 days in receivables) f. Inventory Turnover 2019 B. Number of Days Sales in Inventory 2019 (Company policy states 50 days to turn over inventory) h. Ratio of Liabilities to Stockholders' Equity 2018 and 2019 e. i. Return on Total Assets 2019 j. Return on Stockholders' Equity 2019 k. Earnings Per Share 2018 and 2019 The financial statements provided in this practice set can also be downloaded from Blackboard. An example of a Statement of Cash Flow has been provided at the end of the Practice Set. Download the Excel files (Income Statement and Balance Sheet) from Blackboard and add a column and calculate the ratios for the vertical and horizontal analysis. 5. Acting as an accounting advisor to the firm, prepare a memo in which you analyze the financial statements you prepared in step two and prepare an analysis of the company's financial position. Identify two strengths and two weaknesses in the company. Make two OCIETY recommendations to improve the company's financial position. Be specific in each of the recommendations and use the ratios to support your analysis, The length should be no mor than three paragraphs; one for strengths, one for weaknesses and one for recommendations. Blackboard Instructions 6. Memo analyzing the company's strengths and weaknesses with two recommendations. In Blackboard you will write a memo using ratios to analyze the strengths and weaknesses of the company. Make sure there are no spelling, grammatical, or punctuation errors. a. b. Add information concerning numbers here and enter Blackboard as specified below When the answer is in units enter the number as is (See example below) C. 280 When the answer is for ratios (ie. Current ratio) and has a decimal take the decimal out two decimal spaces (See example below) 1. 280.89 d. e. When ratios are in days/times take out to two decimal places and write days or times after the number (See example below) 1. 280.96 days or times f. When the answer is in dollars ALWAYS include a dollar sign and cents even if the cents is zero add .00 (See example below) i. $280.00 or $3,800.00 CCOUNTING FOCTETY Cumparutive Halance Seet Robust Robots, Inc. Comparative Balance Sheet December31, 2019 and 2018 Assets 2019 2018 Current Asets: Cash G5.000 80,000 100.000 Accounts Recelvable, net 150,000 Merchandise Inventory 135.000 70,000 Supplies Prepaid insurance 9.700 500 30,000 10,000 Total Current Assets 389,700 260,500 Property, Plant.and Eguipment: Equipment Less: Accumulated Depreciation - Equipment Total Property Plant, and Equipment 500,000 240,000 (80,000) (90,000) 420,000 150,000 Total Assets B09,700 410,500 CCOUNTING OeTETY 2018 2019 Liatities and Stackholders Equity Current Liabilities: Accounts Payable 150,000 40.000 40,000 10,000 40,000 50,000 110,0 -10, 10 inearmed Revenue 30,000 Salaries Payalle Fedural income Taxes Pavatie Total Current Liobilities 10,000 130.000 240,000 Long Term Liabilities Note Payable 130,000 130,000 Total Long Tarm Liabilities Total Liabnties 370,000 130,000 Stockholders' Equity: Common Stock, $10 Par Paid in Capital in Excess of Par 170,000 100,000 43,700 226,000 180,500 Retained Earnings 439,700 280,500 Total Stockholders Equity Total Liabilities and Stockholders' Equity 809,700 410,500 Cmparative lncom Statement Robust Robots, Inc. Comparative Statement of tncome For the Years Ended December 31, 2019 and 2018 2018 2019 700,000 524,300 500,000 420.000 Sales Cost of Goods Sold Gross Margin 180,000 175,700 Operating Expenses: Salaries and Wages Expertse Rent Expense Depreciation Expense 100,000 47.290 20,256 20,000 20,000 10,000 130,000 87,546 88,154 Total Operoting Expenses 50,000 Income from Operations LOss an Sale of Equipnent (5,213) (3,656) is (5,000) (5.000) Interest Expense Increase (Decrease) in Operoting (8,869) Income 79,285 (23,786) 45,000 Income before Taxes (13,500) 31,500 Federal Income Taxes Net Income 55,500 6|Pa Caps Ln CCOUNTING OCTETY Compantive Statement of Retained Earnings Robust Robots, Inc. Comparative Statement of Retained Earninga For the Years Ended December 31, 2019 and 2018 2019 2018 Retained Earnings, Beginning of Year 180,500 176,000 Net Income 55,500 10,000 31,500 27,000 Less. Dividends Retained Eaarnings, End of Year 1. Equipment with a cost of $90,000 on which depreciation has been recorded, was sold for cash. Additional equipment was purchased for cash and a long-term note payable. 2. Stock was issued for cash. 3. The dividends were paid in cash. 226,000 180,500
Step by Step Solution
★★★★★
3.42 Rating (158 Votes )
There are 3 Steps involved in it
Step: 1
Comparative Balance Sheet Dec 31 2019 2018 Assets 2019 2018 increasedecrease change current assets cash 65000 80000 15000 1875 accounts receivable 150000 100000 50000 5000 inventory 135000 70000 65000 ...
Get Instant Access to Expert-Tailored Solutions
See step-by-step solutions with expert insights and AI powered tools for academic success
Step: 2

Step: 3

Ace Your Homework with AI
Get the answers you need in no time with our AI-driven, step-by-step assistance
Get Started


