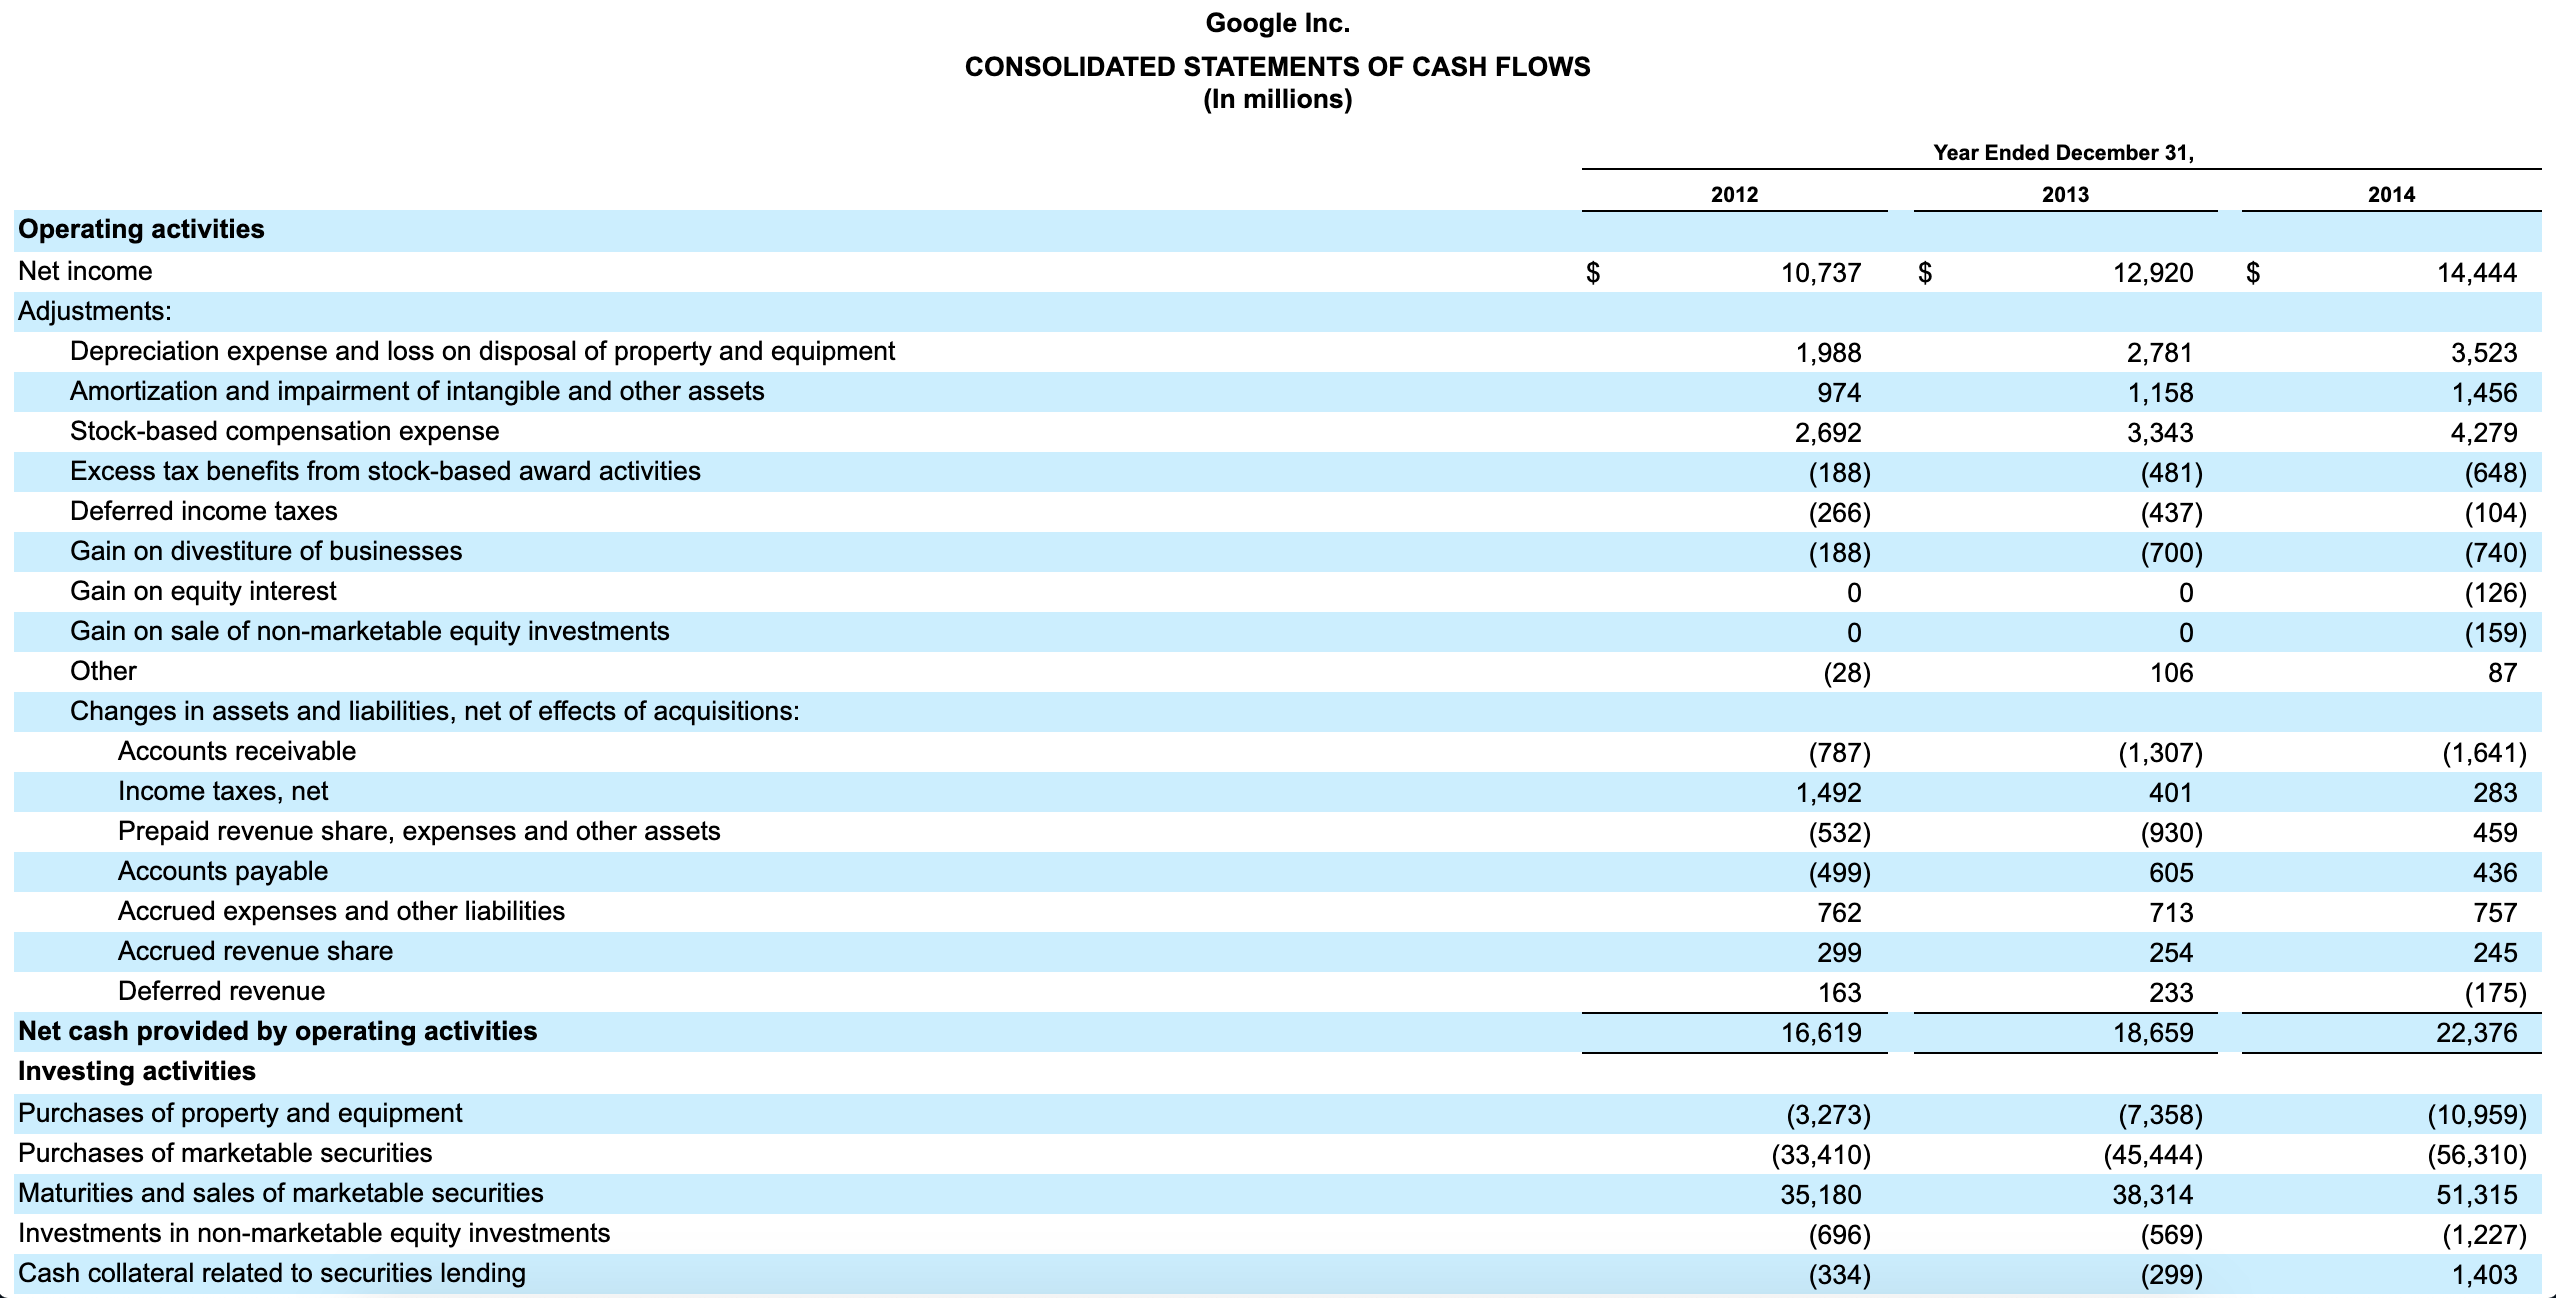
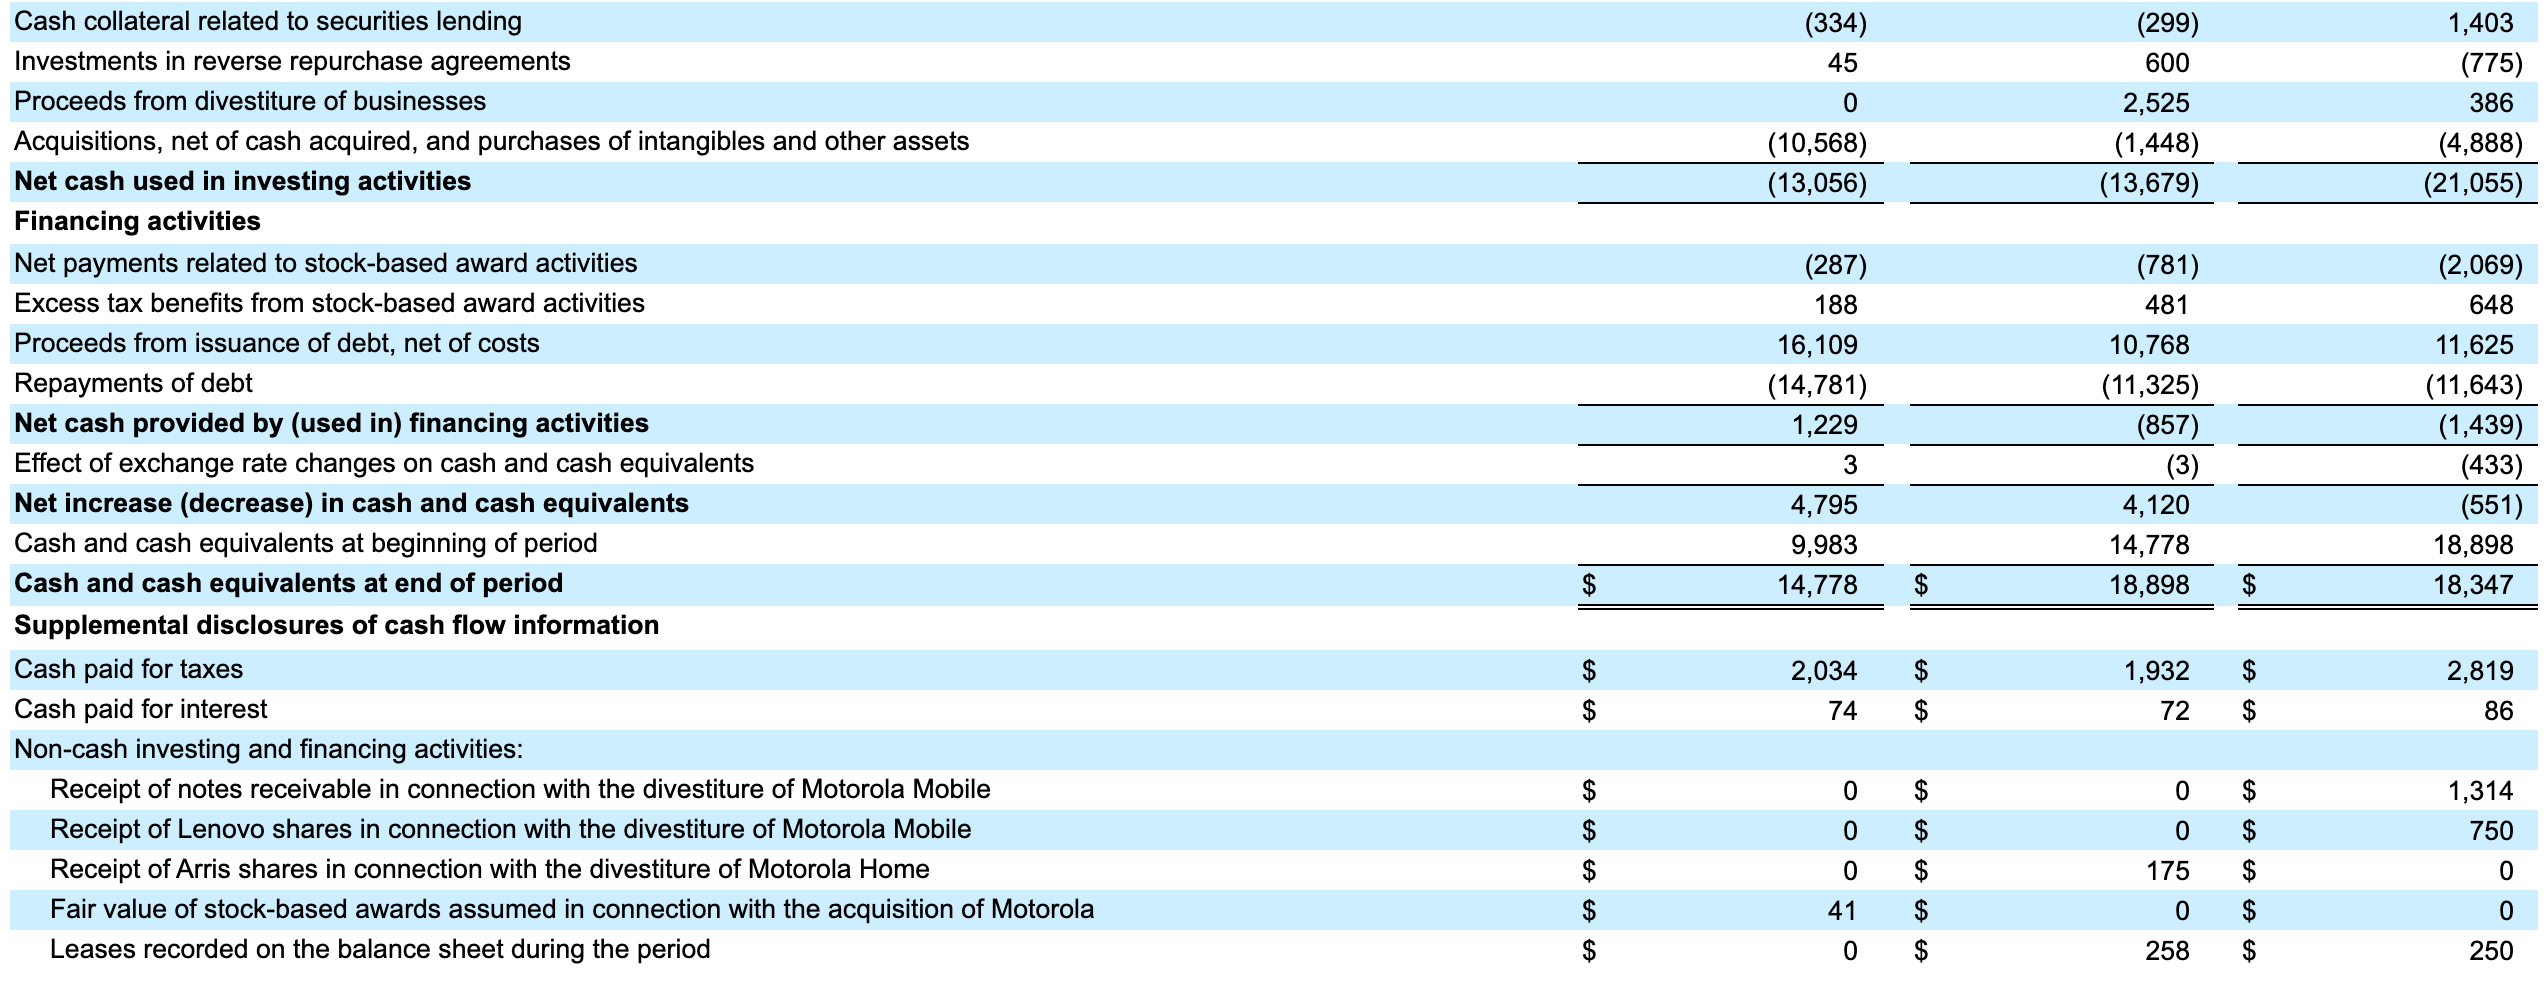
Using information from the statement of cash flows, answer the following questions for Google: 1. Which method, direct or indirect, was used to prepare the companys Statement of Cash Flows? How can you tell? 2. How much cash and cash equivalents did the company have on hand at the end of its most recent fiscal year? 3. What is the trend in the companys net cash from operations over the past three years? 4. What were the significant cash flows from or used by financing activities during its most recent fiscal year? 5. What were the significant cash flows from or used by investing activities during its most recent fiscal year?


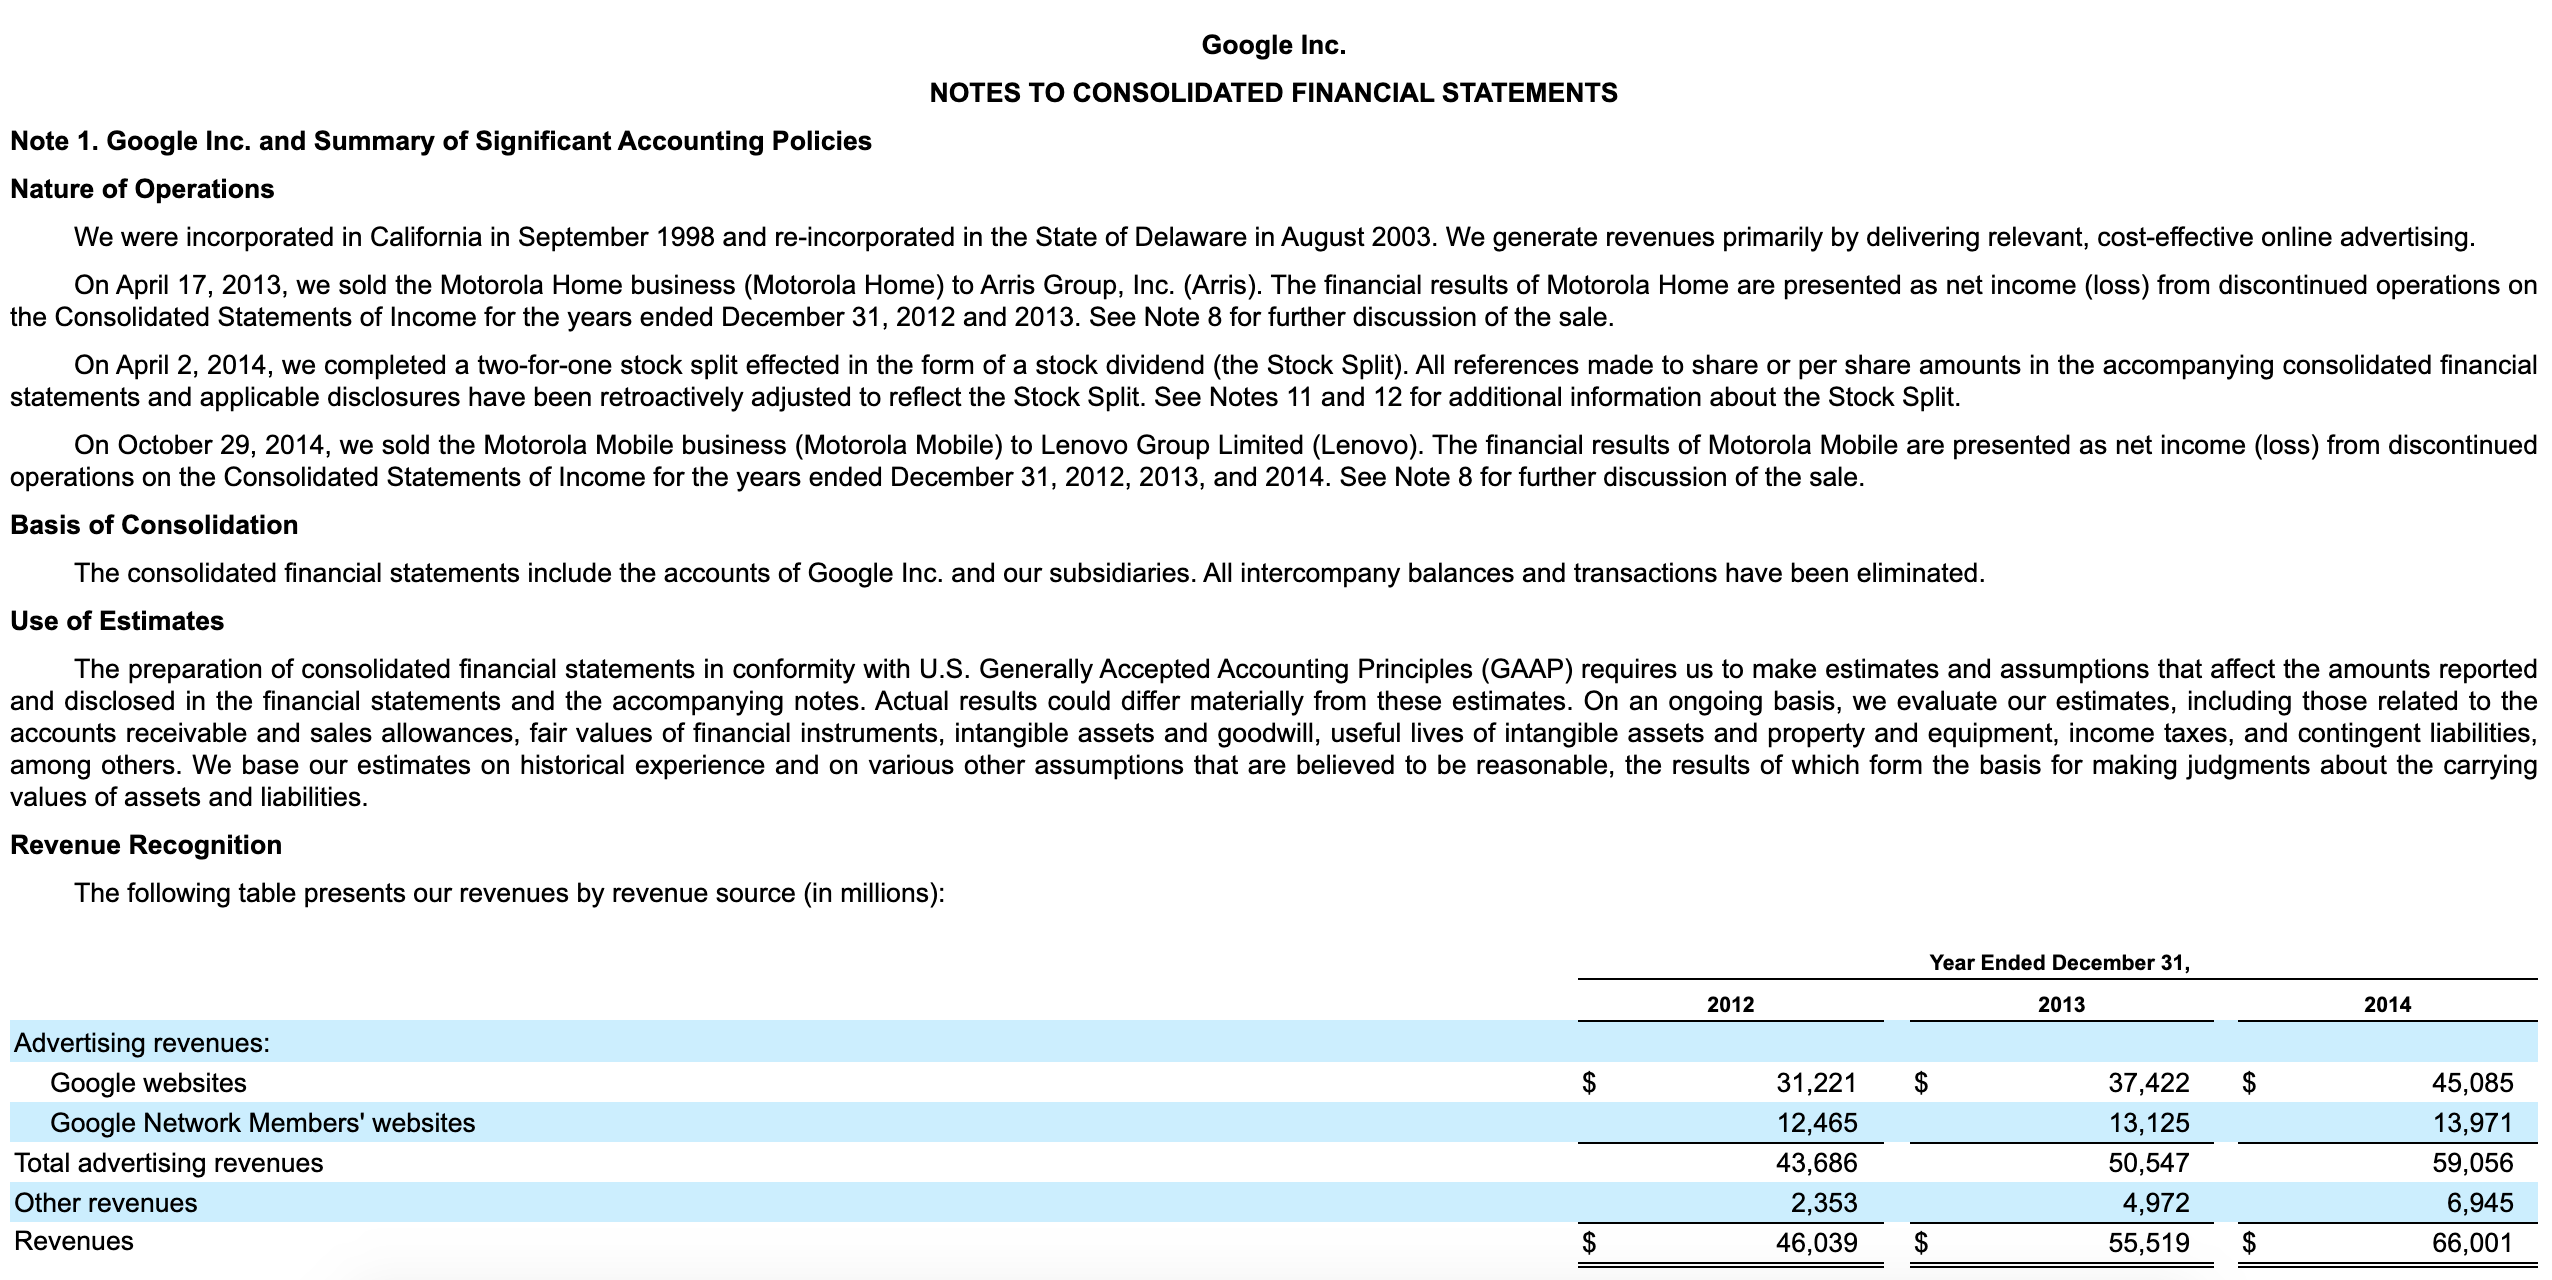
Google Inc. CONSOLIDATED STATEMENTS OF CASH FLOWS (In millions) Year Ended December 31, 2012 2013 2014 10,737 $ 12,920 14,444 1,988 974 2,692 (188) (266) (188) 0 2,781 1,158 3,343 (481) (437) (700) 0 3,523 1,456 4,279 (648) (104) (740) (126) (159) 87 0 0 (28) 106 Operating activities Net income Adjustments: Depreciation expense and loss on disposal of property and equipment Amortization and impairment of intangible and other assets Stock-based compensation expense Excess tax benefits from stock-based award activities Deferred income taxes Gain on divestiture of businesses Gain on equity interest Gain on sale of non-marketable equity investments Other Changes in assets and liabilities, net of effects of acquisitions: Accounts receivable Income taxes, net Prepaid revenue share, expenses and other assets Accounts payable Accrued expenses and other liabilities Accrued revenue share Deferred revenue Net cash provided by operating activities Investing activities Purchases of property and equipment Purchases of marketable securities Maturities and sales of marketable securities Investments in non-marketable equity investments Cash collateral related to securities lending (1,641) 283 (1,307) 401 (930) 605 459 (787) 1,492 (532) (499) 762 299 163 16,619 713 254 233 18,659 436 757 245 (175) 22,376 (3,273) (33,410) 35,180 (696) (334) (7,358) (45,444) 38,314 (569) (299) (10,959) (56,310) 51,315 (1,227) 1,403 (334) 45 0 (299) 600 2,525 (1,448) (13,679) 1,403 (775) 386 (4,888) (21,055) (10,568) (13,056) (287) 188 16,109 (14,781) 1,229 Cash collateral related to securities lending Investments in reverse repurchase agreements Proceeds from divestiture of businesses Acquisitions, net of cash acquired, and purchases of intangibles and other assets Net cash used in investing activities Financing activities Net payments related to stock-based award activities Excess tax benefits from stock-based award activities Proceeds from issuance of debt, net of costs Repayments of debt Net cash provided by (used in) financing activities Effect exchange rate changes on cash and cash equivalents Net increase (decrease) in cash and cash equivalents Cash and cash equivalents at beginning of period Cash and cash equivalents at end of period Supplemental disclosures of cash flow information Cash paid for taxes Cash paid for interest Non-cash investing and financing activities: Receipt of notes receivable in connection with the divestiture of Motorola Mobile Receipt of Lenovo shares in connection with the divestiture of Motorola Mobile Receipt of Arris shares in connection with the divestiture of Motorola Home Fair value of stock-based awards assumed in connection with the acquisition of Motorola Leases recorded on the balance sheet during the period (781) 481 10,768 (11,325) (857) (3) 4,120 14,778 18,898 (2,069) 648 11,625 (11,643) (1,439) (433) (551) 18,898 18,347 3 4,795 9,983 14,778 $ $ $ 2,034 74 1,932 72 2,819 86 $ 0 $ 1,314 750 0 0 A A A A A 175 0 41 0 0 0 258 250 Google Inc. NOTES TO CONSOLIDATED FINANCIAL STATEMENTS Note 1. Google Inc. and Summary of Significant Accounting Policies Nature of Operations We were incorporated in California in September 1998 and re-incorporated in the State of Delaware in August 2003. We generate revenues primarily by delivering relevant, cost-effective online advertising. On April 17, 2013, we sold the Motorola Home business (Motorola Home) to Arris Group, Inc. (Arris). The financial results of Motorola Home are presented as net income (loss) from discontinued operations on the Consolidated Statements of Income for the years ended December 31, 2012 and 2013. See Note 8 for further discussion of the sale. On April 2, 2014, we completed a two-for-one stock split effected in the form of a stock dividend (the Stock Split). All references made to share or per share amounts in the accompanying consolidated financial statements and applicable disclosures have been retroactively adjusted to reflect the Stock Split. See Notes 11 and 12 for additional information about the Stock Split. On October 29, 2014, we sold the Motorola Mobile business (Motorola Mobile) to Lenovo Group Limited (Lenovo). The financial results of Motorola Mobile are presented as net income (loss) from discontinued operations on the Consolidated Statements of Income for the years ended December 31, 2012, 2013, and 2014. See Note 8 for further discussion of the sale. Basis of Consolidation The consolidated financial statements include the accounts of Google Inc. and our subsidiaries. All intercompany balances and transactions have been eliminated. Use of Estimates The preparation of consolidated financial statements in conformity with U.S. Generally Accepted Accounting Principles (GAAP) requires us to make estimates and assumptions that affect the amounts reported and disclosed in the financial statements and the accompanying notes. Actual results could differ materially from these estimates. On an ongoing basis, we evaluate our estimates, including those related to the accounts receivable and sales allowances, fair values of financial instruments, intangible assets and goodwill, useful lives of intangible assets and property and equipment, income taxes, and contingent liabilities, among others. We base our estimates on historical experience and on various other assumptions that are believed to be reasonable, the results of which form the basis for making judgments about the carrying values of assets and liabilities. Revenue Recognition The following table presents our revenues by revenue source (in millions): Year Ended December 31, 2012 2013 2014 $ Advertising revenues: Google websites Google Network Members' websites Total advertising revenues Other revenues Revenues 31,221 12,465 43,686 2,353 46,039 37,422 13,125 50,547 4,972 55,519 45,085 13,971 59,056 6,945 66,001 $ $ $


