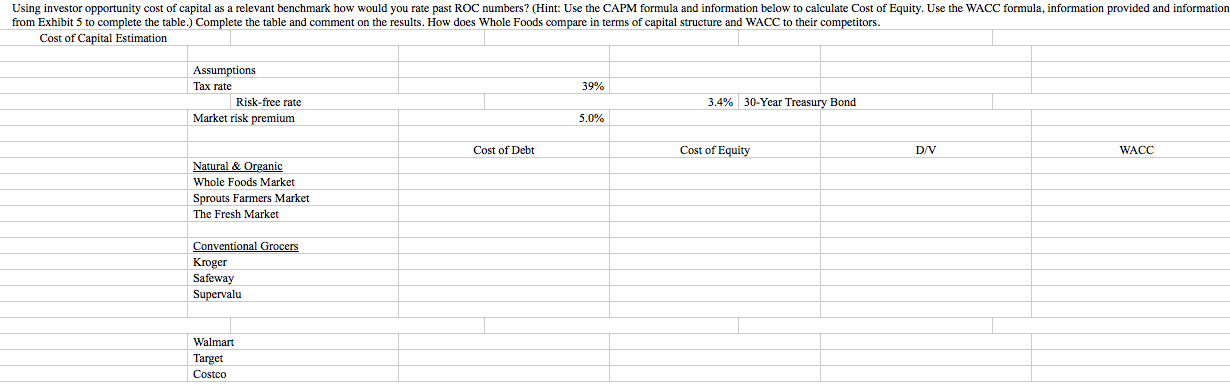
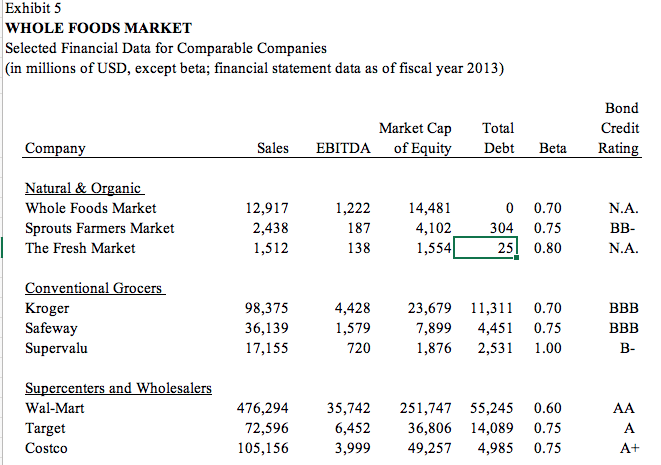
Using investor opportunity cost of capital as a relevant benchmark how would you rate past ROC numbers? (Hint: Use the CAPM formula and information below to calculate Cost of Equity. Use the WACC formula, information provided and information from Exhibit 5 to complete the table.) Complete the table and comment on the results. How does Whole Foods compare in terms of capital structure and WACC to their competitors. Cost of Capital Estimation 39% Assumptions Tax rate Risk-free rate Market risk premium 3.4% 30-Year Treasury Bond 5.0% Cost of Debt Cost of Equity D/V WACC Natural & Organic Whole Foods Market Sprouts Farmers Market The Fresh Market Conventional Grocers Kroger Safeway Supervalu Walmart Target Costco Exhibit 5 WHOLE FOODS MARKET Selected Financial Data for Comparable Companies (in millions of USD, except beta; financial statement data as of fiscal year 2013) Market Cap EBITDA of Equity Total Debt Bond Credit Rating Company Sales Beta N.A. Natural & Organic Whole Foods Market Sprouts Farmers Market The Fresh Market 12,917 2,438 1,512 1,222 14,481 0 0.70 1874,102304 0.75 138 1,554 25! 0.80 BB- N.A. Conventional Grocers Kroger Safeway Supervalu 98,375 36,139 17,155 4,428 1,579 720 23,679 7,899 1,876 11,311 4,451 2,531 0.70 0.75 1.00 B BBB B- Supercenters and Wholesalers Wal-Mart Target Costco 476,294 72,596 105,156 35,742 6,452 3,999 251,747 36,806 49,257 55,245 14,089 4,985 0.60 0.75 0.75 Using investor opportunity cost of capital as a relevant benchmark how would you rate past ROC numbers? (Hint: Use the CAPM formula and information below to calculate Cost of Equity. Use the WACC formula, information provided and information from Exhibit 5 to complete the table.) Complete the table and comment on the results. How does Whole Foods compare in terms of capital structure and WACC to their competitors. Cost of Capital Estimation 39% Assumptions Tax rate Risk-free rate Market risk premium 3.4% 30-Year Treasury Bond 5.0% Cost of Debt Cost of Equity D/V WACC Natural & Organic Whole Foods Market Sprouts Farmers Market The Fresh Market Conventional Grocers Kroger Safeway Supervalu Walmart Target Costco Exhibit 5 WHOLE FOODS MARKET Selected Financial Data for Comparable Companies (in millions of USD, except beta; financial statement data as of fiscal year 2013) Market Cap EBITDA of Equity Total Debt Bond Credit Rating Company Sales Beta N.A. Natural & Organic Whole Foods Market Sprouts Farmers Market The Fresh Market 12,917 2,438 1,512 1,222 14,481 0 0.70 1874,102304 0.75 138 1,554 25! 0.80 BB- N.A. Conventional Grocers Kroger Safeway Supervalu 98,375 36,139 17,155 4,428 1,579 720 23,679 7,899 1,876 11,311 4,451 2,531 0.70 0.75 1.00 B BBB B- Supercenters and Wholesalers Wal-Mart Target Costco 476,294 72,596 105,156 35,742 6,452 3,999 251,747 36,806 49,257 55,245 14,089 4,985 0.60 0.75 0.75