Answered step by step
Verified Expert Solution
Question
1 Approved Answer
USING MATLAB 7. In the previous lab exercise, the accumulated cyclone energy index (ACE) was introduced. Use the data to solve the following problem. The

USING MATLAB
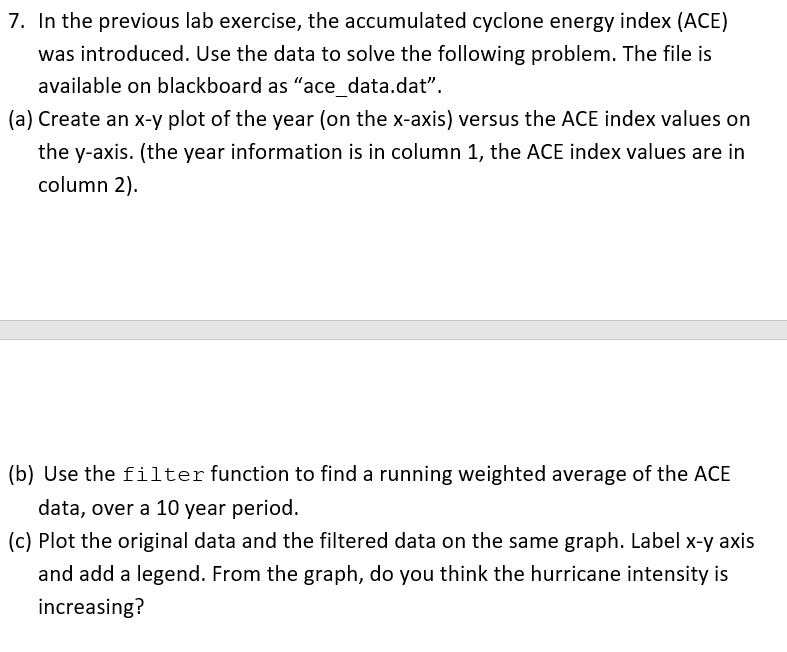
7. In the previous lab exercise, the accumulated cyclone energy index (ACE) was introduced. Use the data to solve the following problem. The file is available on blackboard as "ace data.dat". (a) Create an x-y plot of the year (on the x-axis) versus the ACE index values orn the y-axis. (the year information is in column 1, the ACE index values are in column 2) (b) Use the filter function to find a running weighted average of the ACE data, over a 10 year period. (c) Plot the original data and the filtered data on the same graph. Label x-y axis and add a legend. From the graph, do you think the hurricane intensity is increasing? 7. In the previous lab exercise, the accumulated cyclone energy index (ACE) was introduced. Use the data to solve the following problem. The file is available on blackboard as "ace data.dat". (a) Create an x-y plot of the year (on the x-axis) versus the ACE index values orn the y-axis. (the year information is in column 1, the ACE index values are in column 2) (b) Use the filter function to find a running weighted average of the ACE data, over a 10 year period. (c) Plot the original data and the filtered data on the same graph. Label x-y axis and add a legend. From the graph, do you think the hurricane intensity is increasingStep by Step Solution
There are 3 Steps involved in it
Step: 1

Get Instant Access to Expert-Tailored Solutions
See step-by-step solutions with expert insights and AI powered tools for academic success
Step: 2

Step: 3

Ace Your Homework with AI
Get the answers you need in no time with our AI-driven, step-by-step assistance
Get Started


