Answered step by step
Verified Expert Solution
Question
1 Approved Answer
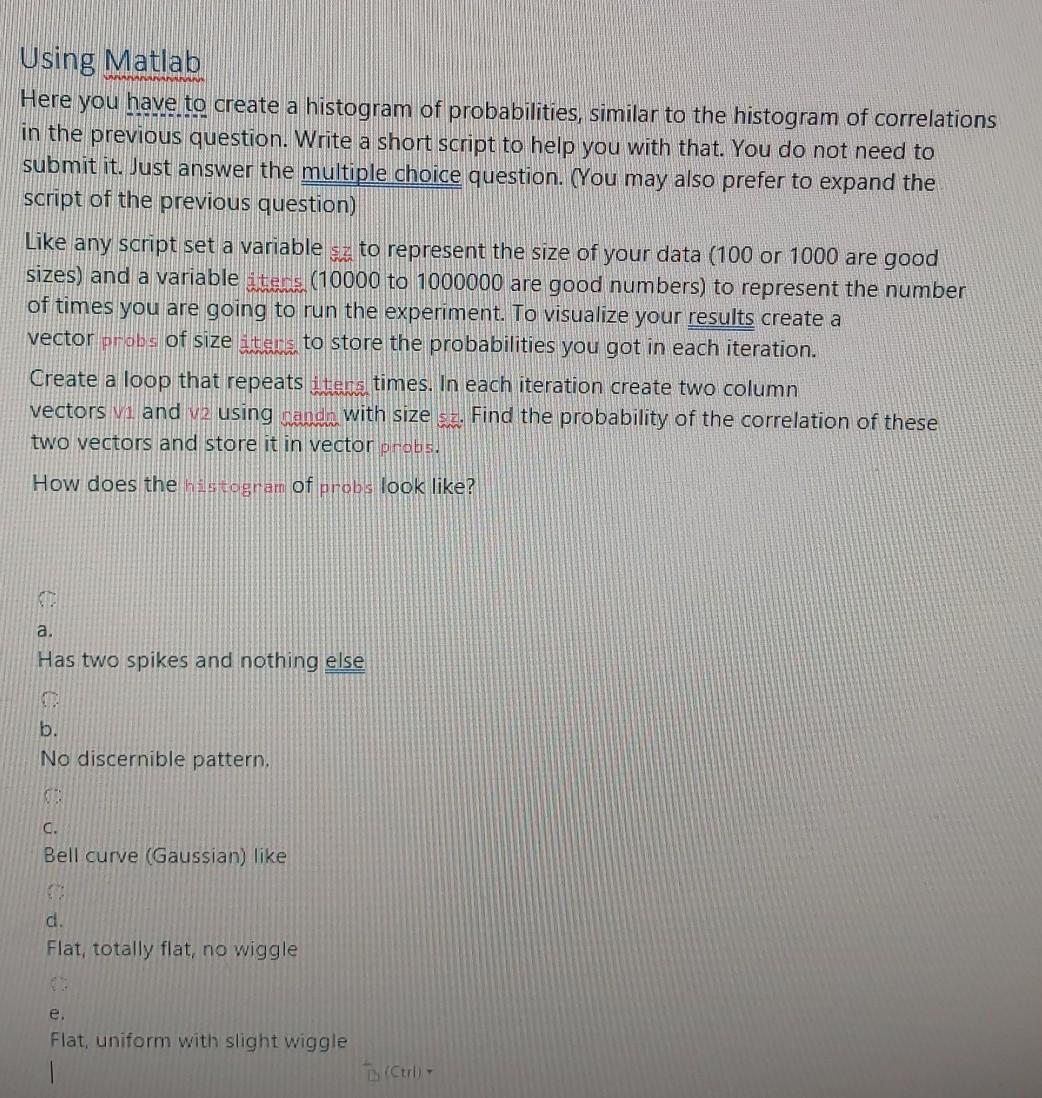
Using Matlab Here you have to create a histogram of probabilities, similar to the histogram of correlations in the previous question. Write a short script

Using Matlab Here you have to create a histogram of probabilities, similar to the histogram of correlations in the previous question. Write a short script to help you with that. You do not need to submit it. Just answer the multiple choice question. (You may also prefer to expand the script of the previous question) Like any script set a variable sz to represent the size of your data (100 or 1000 are good sizes) and a variable iters (10000 to 1000000 are good numbers) to represent the number of times you are going to run the experiment. To visualize your results create a vector probs of size items to store the probabilities you got in each iteration. Create a loop that repeats itens times. In each iteration create two column vectors 1 and 2 using nandin with size cz. Find the probability of the correlation of these two vectors and store it in vector probs. How does the histogram of probs look like? a. Has two spikes and nothing else b. No discernible pattern, c. Bell curve (Gaussian) like d. Flat, totally flat, no wiggle e. Flat, uniform with slight wiggle 2 (Ctrl
Step by Step Solution
There are 3 Steps involved in it
Step: 1

Get Instant Access to Expert-Tailored Solutions
See step-by-step solutions with expert insights and AI powered tools for academic success
Step: 2

Step: 3

Ace Your Homework with AI
Get the answers you need in no time with our AI-driven, step-by-step assistance
Get Started


