Question
Using MATLAB, plot the function y(x) = e-x sin(x) for x between 0 and 4 in steps of 0.1. Create the following types of

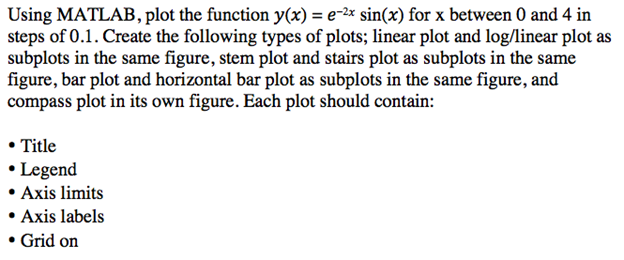
Using MATLAB, plot the function y(x) = e-x sin(x) for x between 0 and 4 in steps of 0.1. Create the following types of plots; linear plot and log/linear plot as subplots in the same figure, stem plot and stairs plot as subplots in the same figure, bar plot and horizontal bar plot as subplots in the same figure, and compass plot in its own figure. Each plot should contain: Title Legend Axis limits Axis labels Grid on
Step by Step Solution
3.42 Rating (158 Votes )
There are 3 Steps involved in it
Step: 1
clc clear all close all x 0014 y exp2x sinx figure1 ...
Get Instant Access to Expert-Tailored Solutions
See step-by-step solutions with expert insights and AI powered tools for academic success
Step: 2

Step: 3

Ace Your Homework with AI
Get the answers you need in no time with our AI-driven, step-by-step assistance
Get StartedRecommended Textbook for
Electric Machinery
Authors: Charles Kingsley, Jr, Stephen D. Umans
6th Edition
71230106, 9780073660097, 73660094, 978-0071230100
Students also viewed these Accounting questions
Question
Answered: 1 week ago
Question
Answered: 1 week ago
Question
Answered: 1 week ago
Question
Answered: 1 week ago
Question
Answered: 1 week ago
Question
Answered: 1 week ago
Question
Answered: 1 week ago
Question
Answered: 1 week ago
Question
Answered: 1 week ago
Question
Answered: 1 week ago
Question
Answered: 1 week ago
Question
Answered: 1 week ago
Question
Answered: 1 week ago
Question
Answered: 1 week ago
Question
Answered: 1 week ago
Question
Answered: 1 week ago
Question
Answered: 1 week ago
Question
Answered: 1 week ago
Question
Answered: 1 week ago
Question
Answered: 1 week ago
Question
Answered: 1 week ago
Question
Answered: 1 week ago
Question
Answered: 1 week ago
Question
Answered: 1 week ago
View Answer in SolutionInn App


