

Answered step by step
Verified Expert Solution
Question
1 Approved Answer
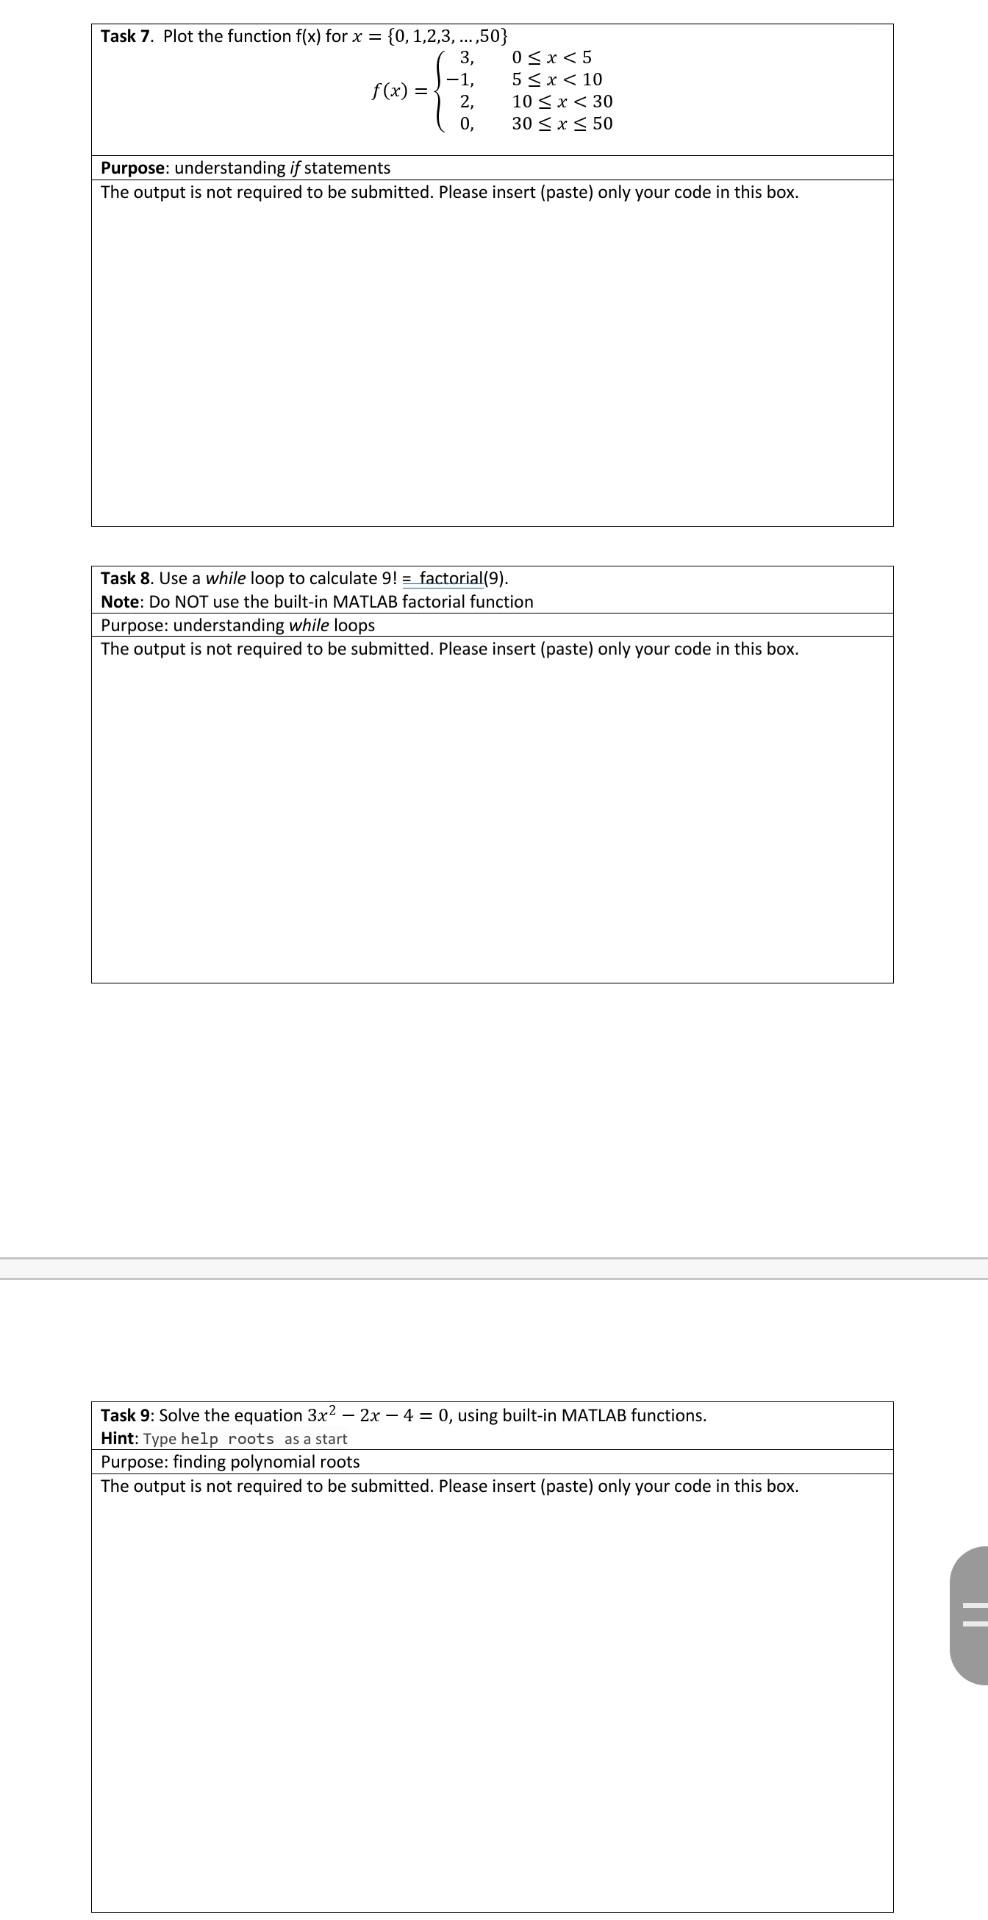
using matlab Task 7. Plot the function f(x) for x = {0, 1,2,3,...,50} 3, 0
using matlab
Task 7. Plot the function f(x) for x = {0, 1,2,3,...,50} 3, 0Step by Step Solution
There are 3 Steps involved in it
Step: 1

Get Instant Access to Expert-Tailored Solutions
See step-by-step solutions with expert insights and AI powered tools for academic success
Step: 2

Step: 3
Ace Your Homework with AI
Get the answers you need in no time with our AI-driven, step-by-step assistance
Get Started
Database Systems Introduction To Databases And Data Warehouses
Authors: Nenad Jukic, Susan Vrbsky, Svetlozar Nestorov
1st Edition
1943153191, 978-1943153190