

Question: using MATLAB The following data were obtained from an experiment: 29.65 28.5528.65 30.1529.35 29.75 29.25 30.65 28.15 29.85 29.05 30.25 30.85 28.75 29.65 3045 29.15
using MATLAB
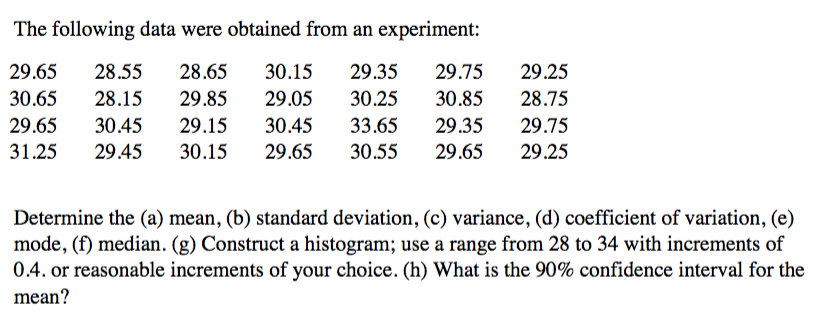
The following data were obtained from an experiment: 29.65 28.5528.65 30.1529.35 29.75 29.25 30.65 28.15 29.85 29.05 30.25 30.85 28.75 29.65 3045 29.15 30.4533.65 29.35 29.75 31.25 29.45 30.15 29.6530.55 29.65 29.25 Determine the (a) mean, (b) standard deviation, (c) variance, (d) coefficient of variation, (e) mode, (f) median. (g) Construct a histogram; use a range from 28 to 34 with increments of 04. or reasonable increments of your choice. (h) What is the 90% confidence interval for the mean
Step by Step Solution
There are 3 Steps involved in it
1 Expert Approved Answer
Step: 1 Unlock

Question Has Been Solved by an Expert!
Get step-by-step solutions from verified subject matter experts
Step: 2 Unlock
Step: 3 Unlock