Using matlab we have to create a function:
Given to us:
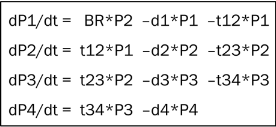
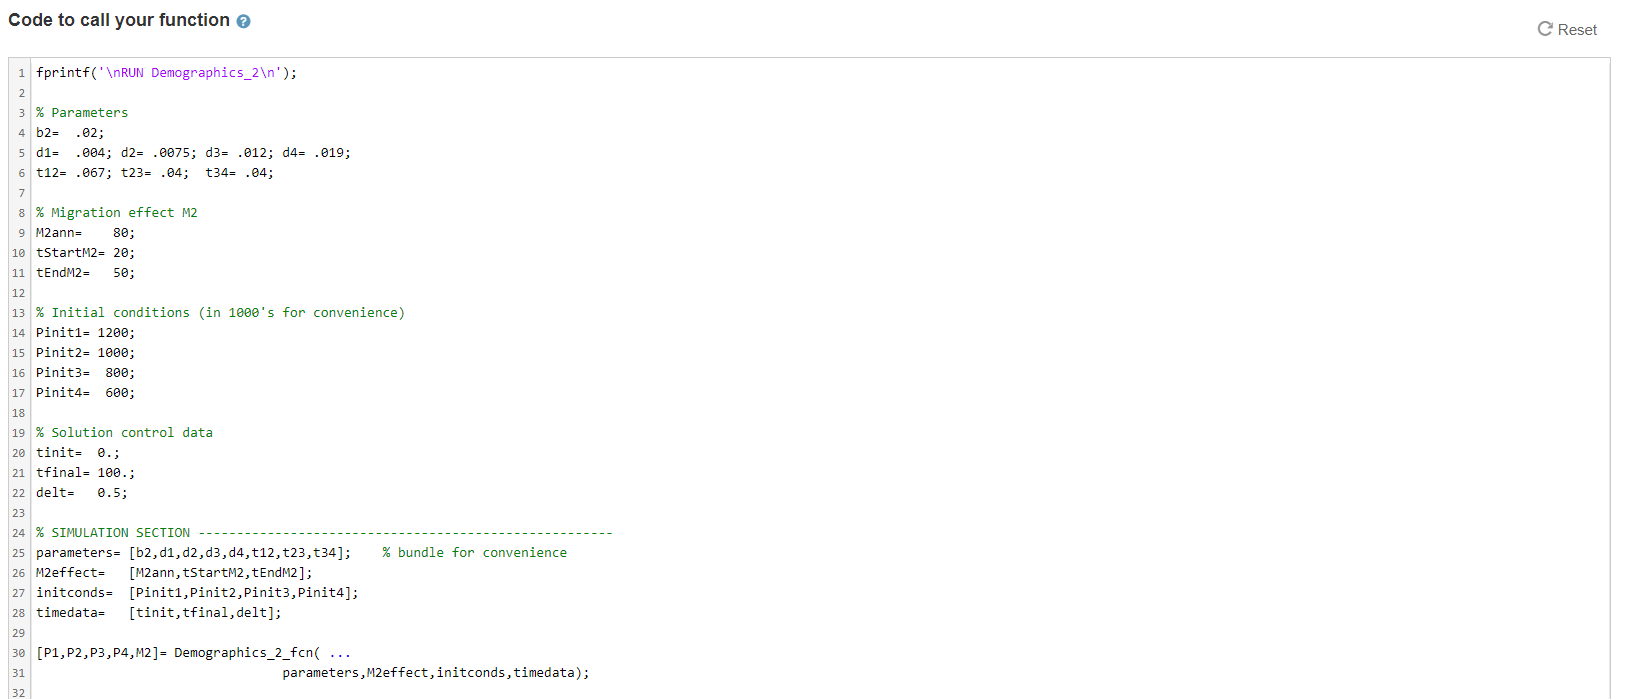
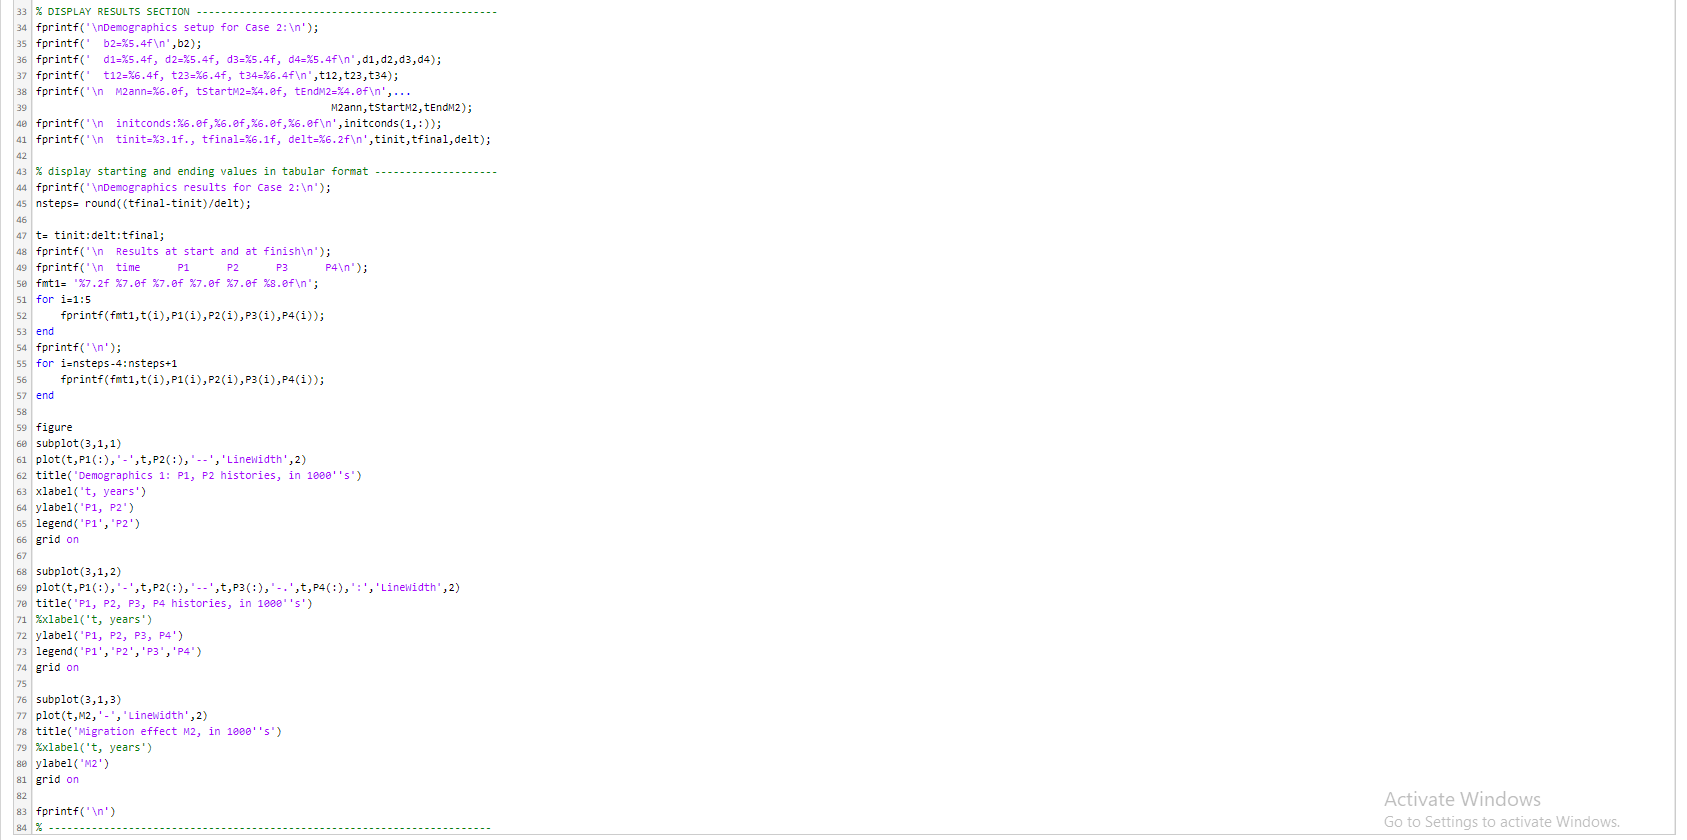
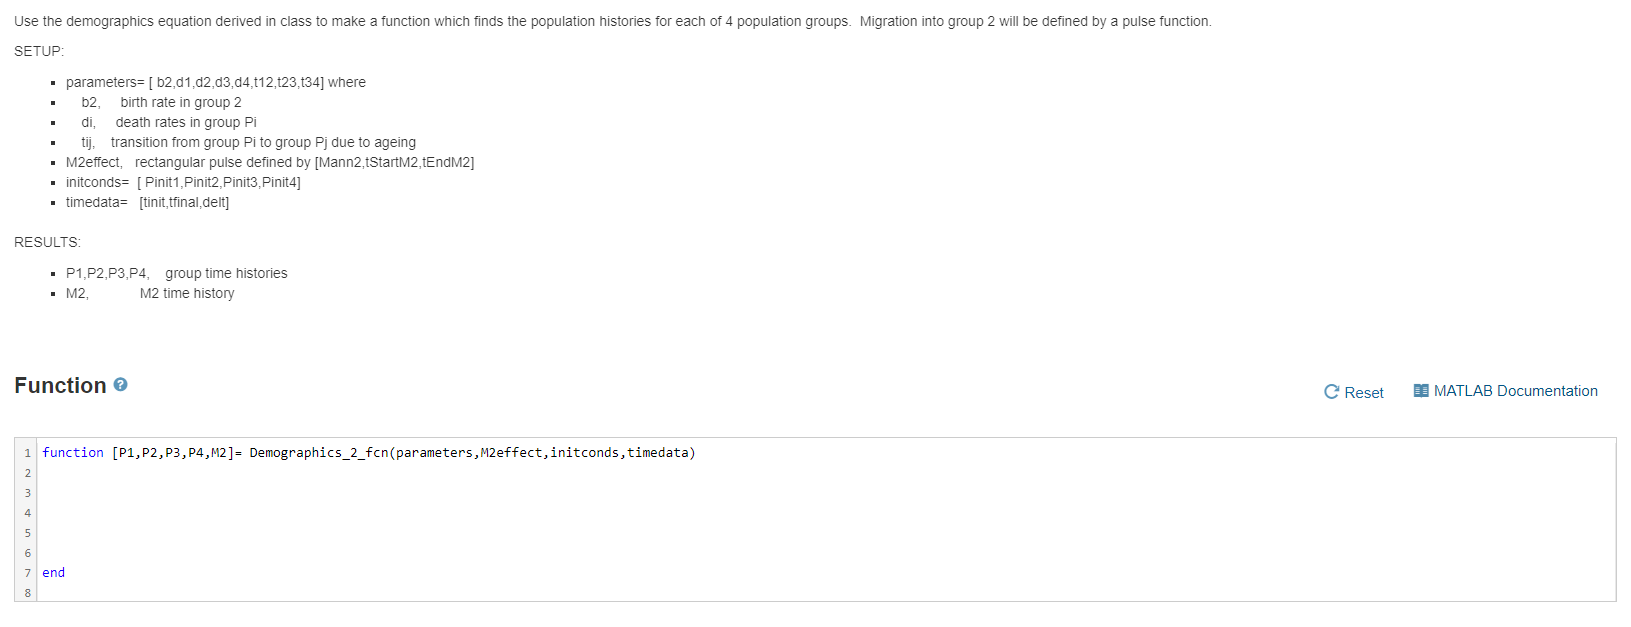
Use the demographics equation derived in class to make a function which finds the population histories for each of 4 population groups. Migration into group 2 will be defined by a pulse function. SETUP parameters= [b2d1d2d3.d4,112,123,t34] where b2 birth rate in group 2 di death rates in group Pi tij, transition from group Pi to group Pj due to ageing M2effect, rectangular pulse defined by [Mann2,tStartM2,tEndM2] initconds= [ Pinit 1, Pinit2 Pinit3, Pinit4] timedata= [tinit,tfinal delt] RESULTS P1, P2,P3,P4, group time histories M2, M2 time history Function C Reset MATLAB Documentation 1 function (P1, P2, P3, P4,M2 ] = Demographics_2_fcn(parameters, M2effect, initconds, timedata) 2 3 4 5 6 7 end 8 dP1/dt = BR*P2 -d1*P1 -t12*P1 dP2/dt = t12*P1 -d2*P2 - 23*P2 dP3/dt = t23*P2 -d3*P3 -t34*P3 dP4/dt = t34 *P3 -d4*P4 Code to call your function C Reset 1 fprintf(" RUN Demographics_2 '); 2 3 % Parameters 4 b2= .02; 5 d1- .004; d2= .0075; d3= .012; 04= .019; 6 t12= .067; t23 - .04; t34= .04; 7 8 % Migration effect M2 9 M2 ann- 80; 10 tStartM2= 20; 11 tEndM2 50; 12 13 % Initial conditions (in 1000's for convenience) 14 Pinit1= 1200; 15 Pinit2= 1000; 16 Pinit3- 800; 17 Pinit4= 600; 18 19 % Solution control data 20 tinit= 0.; 21 tfinal= 100.; 22 delt= 0.5; 23 24 % SIMULATION SECTION 25 parameters= [b2, d1, d2, d3, 04, t12, t23, t34]; 26 M2effect= [M2ann, tStartM2, tEndM2]; 27 initconds [Piniti, Pinit2,Pinit3, Pinit4]; 28 timedata- [tinit, tfinal, delt]; % bundle for convenience 29 30 [P1, P2,P3,P4,M2] = Demographics_2_fcn( ... parameters, M2effect, initconds, timedata); 31 32 39 33 % DISPLAY RESULTS SECTION 34 fprintf(" Demographics setup for case 2: '); 35 fprintf(' b2=%5.4f ', b2); 36 fprintf(' d1=%5.4f, d2=X5.4f, d3=45.4f, d4=%5.4f ',di, d2,03,04); 37 fprintf('t12=%6.4f, t23=%6.4f, t34=%6.4f ', t12, t23, t34); fprintf(" M2ann=%6.0f, tstartM2=24.ef, tEndM2=24.0f ',... M2ann, tstartM2, tEndM2); 40 fprintf(" initconds: 46.8f, %6.8f,x6.ef, x6.0f ', initconds(1,:)); 41 fprintf(" tinit=%3.1f., tfinal=%6.1f, delt=%6.2f ', tinit,tfinal, delt); 42 43 % display starting and ending values in tabular format fprintf(" Demographics results for Case 2: '); 45 nsteps= round((tfinal-tinit)/delt); 46 47 t= tinit:delt:tfinal; 48 fprintf(" Results at start and at finish '); 49 fprintf(" time P1 P2 P3 P4 '); 50 fmt1= '%7.2f %7.0f %7.8f %7.0f %7.0f %8.0f '; 51 for i=1:5 52 fprintf(fmti,t(i),P1(1),P2(i),P3(i),P4(i)); 53 end 54 fprintf(' '); 55 for i=nsteps-4:nsteps+1 56 fprintf(fmti,t(i),P1(i),P2(1),P3(1),P4(i)); 57 end 58 59 figure 60 subplot(3,1,1) 61 plot(t,P1(:),'-',t,P2(:),'--', 'Linewidth',2) 62 title('Demographics 1: P1, P2 histories, in 1880''s") 63 xlabel('t, years') 64 ylabel('P1, P2') 65 legend('P1','P2') 66 grid on 62 67 68 subplot(3,1,2) 69 plot(t,P1(:),'-',t,P2(:),'--',t,P3(:),'-. ',t, P4(:),':', 'Linewidth', 2) 70 title('P1, P2, P3, P4 histories, in 1800's) 71 %xlabel('t, years) 72 ylabel('P1, P2, P3, P4') 73 legend('P1','P2', 'P3','P4') 74 grid on 25 75 76 subplot(3,1,3) 77 plot(t,M2,'-', 'LineWidth', 2) 78 title('Migration effect M2, in 1880''s') 79 %xlabel('t, years') se ylabel('M2') 81 grid on 82 83 fprintf(' ') 84 % ---- Activate Windows Go to Settings to activate Windows Use the demographics equation derived in class to make a function which finds the population histories for each of 4 population groups. Migration into group 2 will be defined by a pulse function. SETUP parameters= [b2d1d2d3.d4,112,123,t34] where b2 birth rate in group 2 di death rates in group Pi tij, transition from group Pi to group Pj due to ageing M2effect, rectangular pulse defined by [Mann2,tStartM2,tEndM2] initconds= [ Pinit 1, Pinit2 Pinit3, Pinit4] timedata= [tinit,tfinal delt] RESULTS P1, P2,P3,P4, group time histories M2, M2 time history Function C Reset MATLAB Documentation 1 function (P1, P2, P3, P4,M2 ] = Demographics_2_fcn(parameters, M2effect, initconds, timedata) 2 3 4 5 6 7 end 8 dP1/dt = BR*P2 -d1*P1 -t12*P1 dP2/dt = t12*P1 -d2*P2 - 23*P2 dP3/dt = t23*P2 -d3*P3 -t34*P3 dP4/dt = t34 *P3 -d4*P4 Code to call your function C Reset 1 fprintf(" RUN Demographics_2 '); 2 3 % Parameters 4 b2= .02; 5 d1- .004; d2= .0075; d3= .012; 04= .019; 6 t12= .067; t23 - .04; t34= .04; 7 8 % Migration effect M2 9 M2 ann- 80; 10 tStartM2= 20; 11 tEndM2 50; 12 13 % Initial conditions (in 1000's for convenience) 14 Pinit1= 1200; 15 Pinit2= 1000; 16 Pinit3- 800; 17 Pinit4= 600; 18 19 % Solution control data 20 tinit= 0.; 21 tfinal= 100.; 22 delt= 0.5; 23 24 % SIMULATION SECTION 25 parameters= [b2, d1, d2, d3, 04, t12, t23, t34]; 26 M2effect= [M2ann, tStartM2, tEndM2]; 27 initconds [Piniti, Pinit2,Pinit3, Pinit4]; 28 timedata- [tinit, tfinal, delt]; % bundle for convenience 29 30 [P1, P2,P3,P4,M2] = Demographics_2_fcn( ... parameters, M2effect, initconds, timedata); 31 32 39 33 % DISPLAY RESULTS SECTION 34 fprintf(" Demographics setup for case 2: '); 35 fprintf(' b2=%5.4f ', b2); 36 fprintf(' d1=%5.4f, d2=X5.4f, d3=45.4f, d4=%5.4f ',di, d2,03,04); 37 fprintf('t12=%6.4f, t23=%6.4f, t34=%6.4f ', t12, t23, t34); fprintf(" M2ann=%6.0f, tstartM2=24.ef, tEndM2=24.0f ',... M2ann, tstartM2, tEndM2); 40 fprintf(" initconds: 46.8f, %6.8f,x6.ef, x6.0f ', initconds(1,:)); 41 fprintf(" tinit=%3.1f., tfinal=%6.1f, delt=%6.2f ', tinit,tfinal, delt); 42 43 % display starting and ending values in tabular format fprintf(" Demographics results for Case 2: '); 45 nsteps= round((tfinal-tinit)/delt); 46 47 t= tinit:delt:tfinal; 48 fprintf(" Results at start and at finish '); 49 fprintf(" time P1 P2 P3 P4 '); 50 fmt1= '%7.2f %7.0f %7.8f %7.0f %7.0f %8.0f '; 51 for i=1:5 52 fprintf(fmti,t(i),P1(1),P2(i),P3(i),P4(i)); 53 end 54 fprintf(' '); 55 for i=nsteps-4:nsteps+1 56 fprintf(fmti,t(i),P1(i),P2(1),P3(1),P4(i)); 57 end 58 59 figure 60 subplot(3,1,1) 61 plot(t,P1(:),'-',t,P2(:),'--', 'Linewidth',2) 62 title('Demographics 1: P1, P2 histories, in 1880''s") 63 xlabel('t, years') 64 ylabel('P1, P2') 65 legend('P1','P2') 66 grid on 62 67 68 subplot(3,1,2) 69 plot(t,P1(:),'-',t,P2(:),'--',t,P3(:),'-. ',t, P4(:),':', 'Linewidth', 2) 70 title('P1, P2, P3, P4 histories, in 1800's) 71 %xlabel('t, years) 72 ylabel('P1, P2, P3, P4') 73 legend('P1','P2', 'P3','P4') 74 grid on 25 75 76 subplot(3,1,3) 77 plot(t,M2,'-', 'LineWidth', 2) 78 title('Migration effect M2, in 1880''s') 79 %xlabel('t, years') se ylabel('M2') 81 grid on 82 83 fprintf(' ') 84 % ---- Activate Windows Go to Settings to activate Windows