Answered step by step
Verified Expert Solution
Question
1 Approved Answer
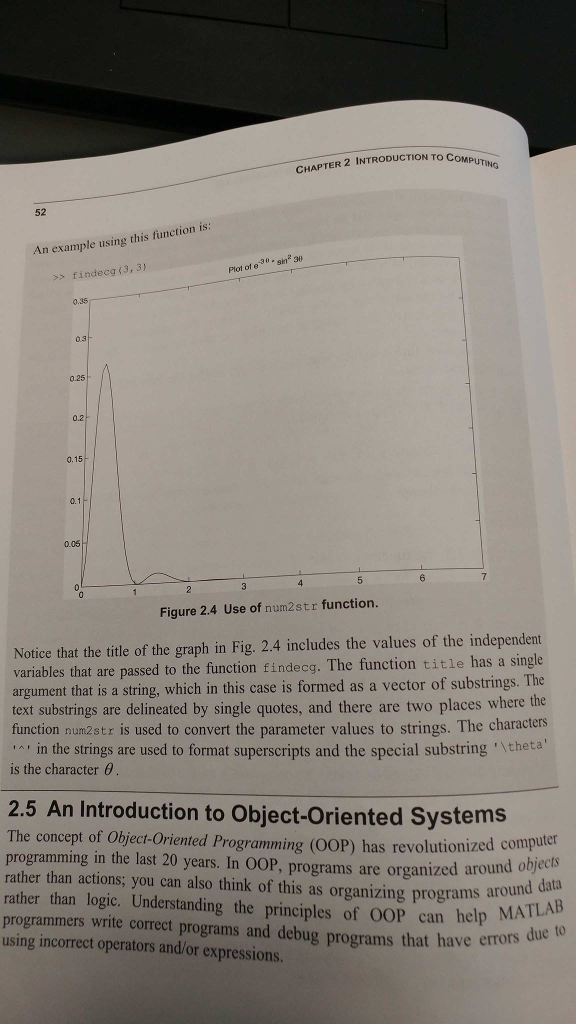
Using MATLAB, write a MATLAB script modeling (approximating) a QRS complex using a time series of three complexes with a constant heart rate (Just use
Using MATLAB, write a MATLAB script modeling (approximating) a QRS complex using a time series of three complexes with a constant heart rate (Just use the info in the grey box)
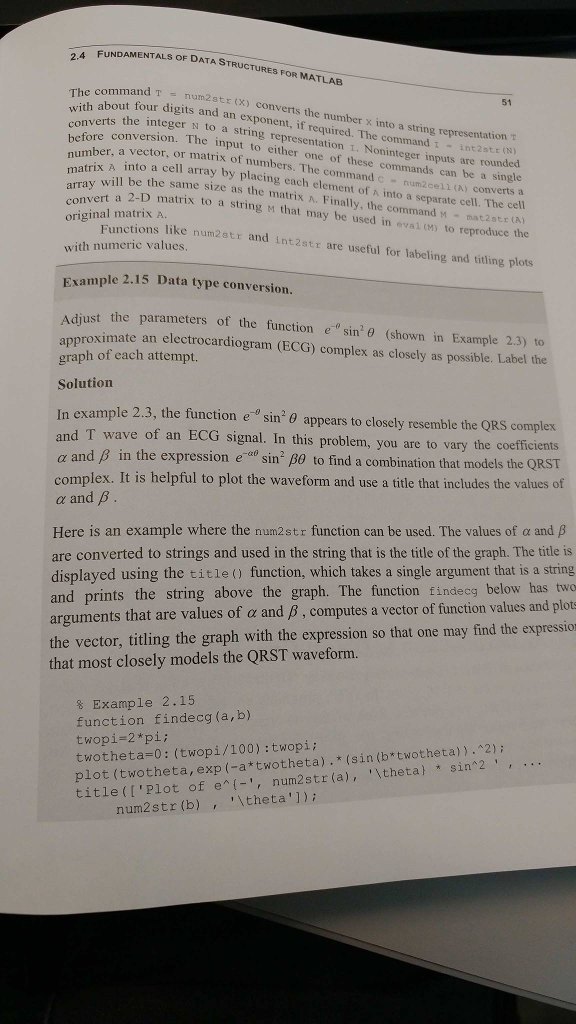
OF DATA STRUCTURES FOR MATLAB The command T - n with about four digits and an exponent, if 51 um2s tr (x) converts the number the integer N to a string representation T X into a string representation T nverts ed. The command 1 - int2str (N) Noninteger inputs are rounded commands can be a single before conversion. The in to either one of these put mber, a vector, or matrix of numbers. The comman d c -num2cell(A) converts a to a cell array by placing each element of A into a separate cell. The cell arrayv conve original matrix A maw ert a 2-D matrix to a string M that may be used in oval (n) to reproduce the Functions like num2str and int2str are useful for labeling and titling plots will be the same size as the matrix A. Finally, the command M mat2str (A) with numeric values xample 2.15 Data type conversion. Adjust the parameters of the function e-o sin, (shown in Example 2.3) to nate an electrocardiogram (ECG) complex as closely as possible graph of each attempt. Solution In example 2.3, the function eo sin' appears to closely resemble the QRS complex and T wave of an ECG signal. In this problem, you are to vary the coefficients and in the expression e-o sin2 to find a combination that models the QRST complex. It is helpful to plot the waveform and use a title that includes the values of Here is an example where the num2str function can be used. The values of and are converted to strings and used in the string that is the title of the graph. The title is displayed using the title () function, which takes a single argument that is a string and prints the string above the graph. The function findecg below has two arguments that are values of and , computes a vector of function values and plot the vector, titling the graph with the expression so that one may find the expressio that most closely models the QRST waveform. % Example 2.15 function findecg (a,b) twopi-2*pi; twotheta-0: (twopi/100) :twopi; plot (twotheta, exp (-a*twotheta) . (sin (b*twotheta)).42) title(I'Plot of e(', num2str (a), 'theta) sin 2', num2str (b)theta')Step by Step Solution
There are 3 Steps involved in it
Step: 1
Get Instant Access to Expert-Tailored Solutions
See step-by-step solutions with expert insights and AI powered tools for academic success
Step: 2
Step: 3
Ace Your Homework with AI
Get the answers you need in no time with our AI-driven, step-by-step assistance
Get Started