Answered step by step
Verified Expert Solution
Question
1 Approved Answer
Using MS Excel, prepare graphs of fractional compositions versus pH for a monoprotic and a diprotic species of your choice. Please use a separate

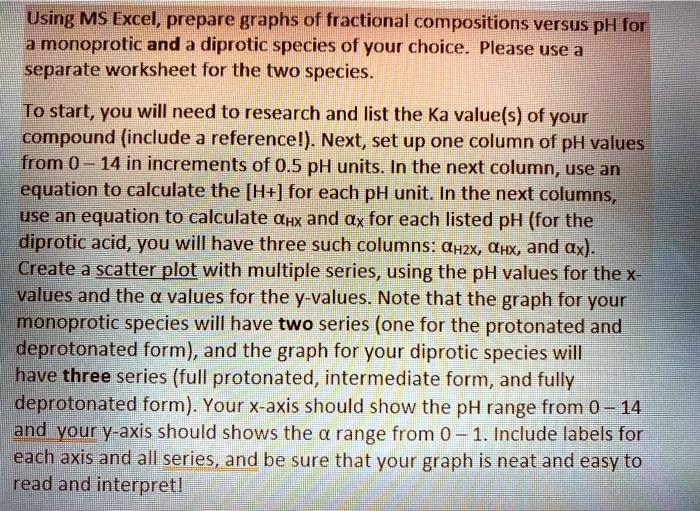
Using MS Excel, prepare graphs of fractional compositions versus pH for a monoprotic and a diprotic species of your choice. Please use a separate worksheet for the two species. To start, you will need to research and list the Ka value(s) of your compound (include a reference!). Next, set up one column of pH values from 0-14 in increments of 0.5 pH units. In the next column, use an equation to calculate the [H+] for each pH unit. In the next columns, use an equation to calculate Hx and ax for each listed pH (for the diprotic acid, you will have three such columns: H2x, Hx, and ax). Create a scatter plot with multiple series, using the pH values for the x- values and the a values for the y-values. Note that the graph for your monoprotic species will have two series (one for the protonated and deprotonated form), and the graph for your diprotic species will have three series (full protonated, intermediate form, and fully deprotonated form). Your x-axis should show the pH range from 0-14 and your y-axis should shows the a range from 0-1. Include labels for each axis and all series, and be sure that your graph is neat and easy to read and interpret!
Step by Step Solution
★★★★★
3.52 Rating (159 Votes )
There are 3 Steps involved in it
Step: 1
Answer 1 Ka Values The Ka values of a compound refers to the acid dissociation constant or the equilibrium constant that describes the strength of an ...
Get Instant Access to Expert-Tailored Solutions
See step-by-step solutions with expert insights and AI powered tools for academic success
Step: 2

Step: 3

Ace Your Homework with AI
Get the answers you need in no time with our AI-driven, step-by-step assistance
Get Started


