Answered step by step
Verified Expert Solution
Question
1 Approved Answer
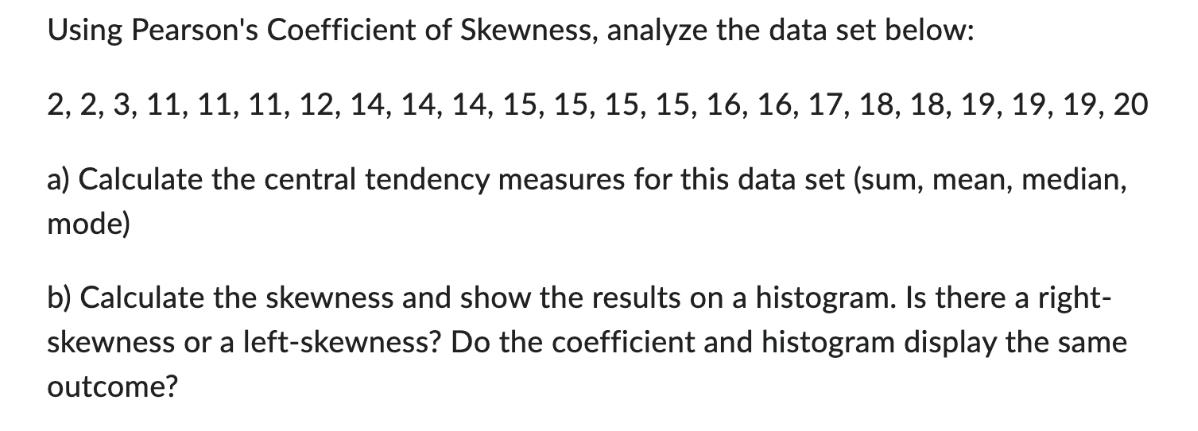
Using Pearson's Coefficient of Skewness, analyze the data set below: 2, 2, 3, 11, 11, 11, 12, 14, 14, 14, 15, 15, 15, 15,

Using Pearson's Coefficient of Skewness, analyze the data set below: 2, 2, 3, 11, 11, 11, 12, 14, 14, 14, 15, 15, 15, 15, 16, 16, 17, 18, 18, 19, 19, 19, 20 a) Calculate the central tendency measures for this data set (sum, mean, median, mode) b) Calculate the skewness and show the results on a histogram. Is there a right- skewness or a left-skewness? Do the coefficient and histogram display the same outcome?
Step by Step Solution
★★★★★
3.35 Rating (155 Votes )
There are 3 Steps involved in it
Step: 1
Let us solve it by step by step approach STEP1 a Calculate the central tendency measures Sum2 2 3 11 ...
Get Instant Access to Expert-Tailored Solutions
See step-by-step solutions with expert insights and AI powered tools for academic success
Step: 2

Step: 3

Ace Your Homework with AI
Get the answers you need in no time with our AI-driven, step-by-step assistance
Get Started


